Case Study: Presentation Graphic
Let’s walk through the process of generating this conceptual model for the presentation of Jody Levison-Johnson’s research:

The Challenge
“I completed my dissertation,” Dr. Levison-Johnson wrote, “and part of what emerged from my findings was a potential conceptual model related to leadership in constraining environments that I was hoping to graphically depict.”
“I didn’t pursue the graphics back during the dissertation process as my Chair didn’t feel it was necessary, but I am starting to take my findings on the road and I wondered about your interest/ability in helping me to graphically represent my findings.”
My interest was high! We set up an initial consult via Zoom, and we talked through the details of the research.
The desired model needed to serve as a foundation for the scope of the client’s research. Our primary challenge was to create a model that satisfied two conflicting needs:
a) use a simple, compelling visual to locate the essence of the research
&
b) contain the seed language for the various branches of conceptual exploration
Quite the quandary, but these paradoxes are what light me up about this work. With our objective clarified, it was time to dig in…
Discovery & Research
With an information-rich project like this, the first step is to clarify and organize the language the model must contain.
The client, having already completed the dissertation, had this information at the ready. She provided it in a clear list:
Leader Characteristics
Personal connection and commitment
Humility
Persistence and tenacity
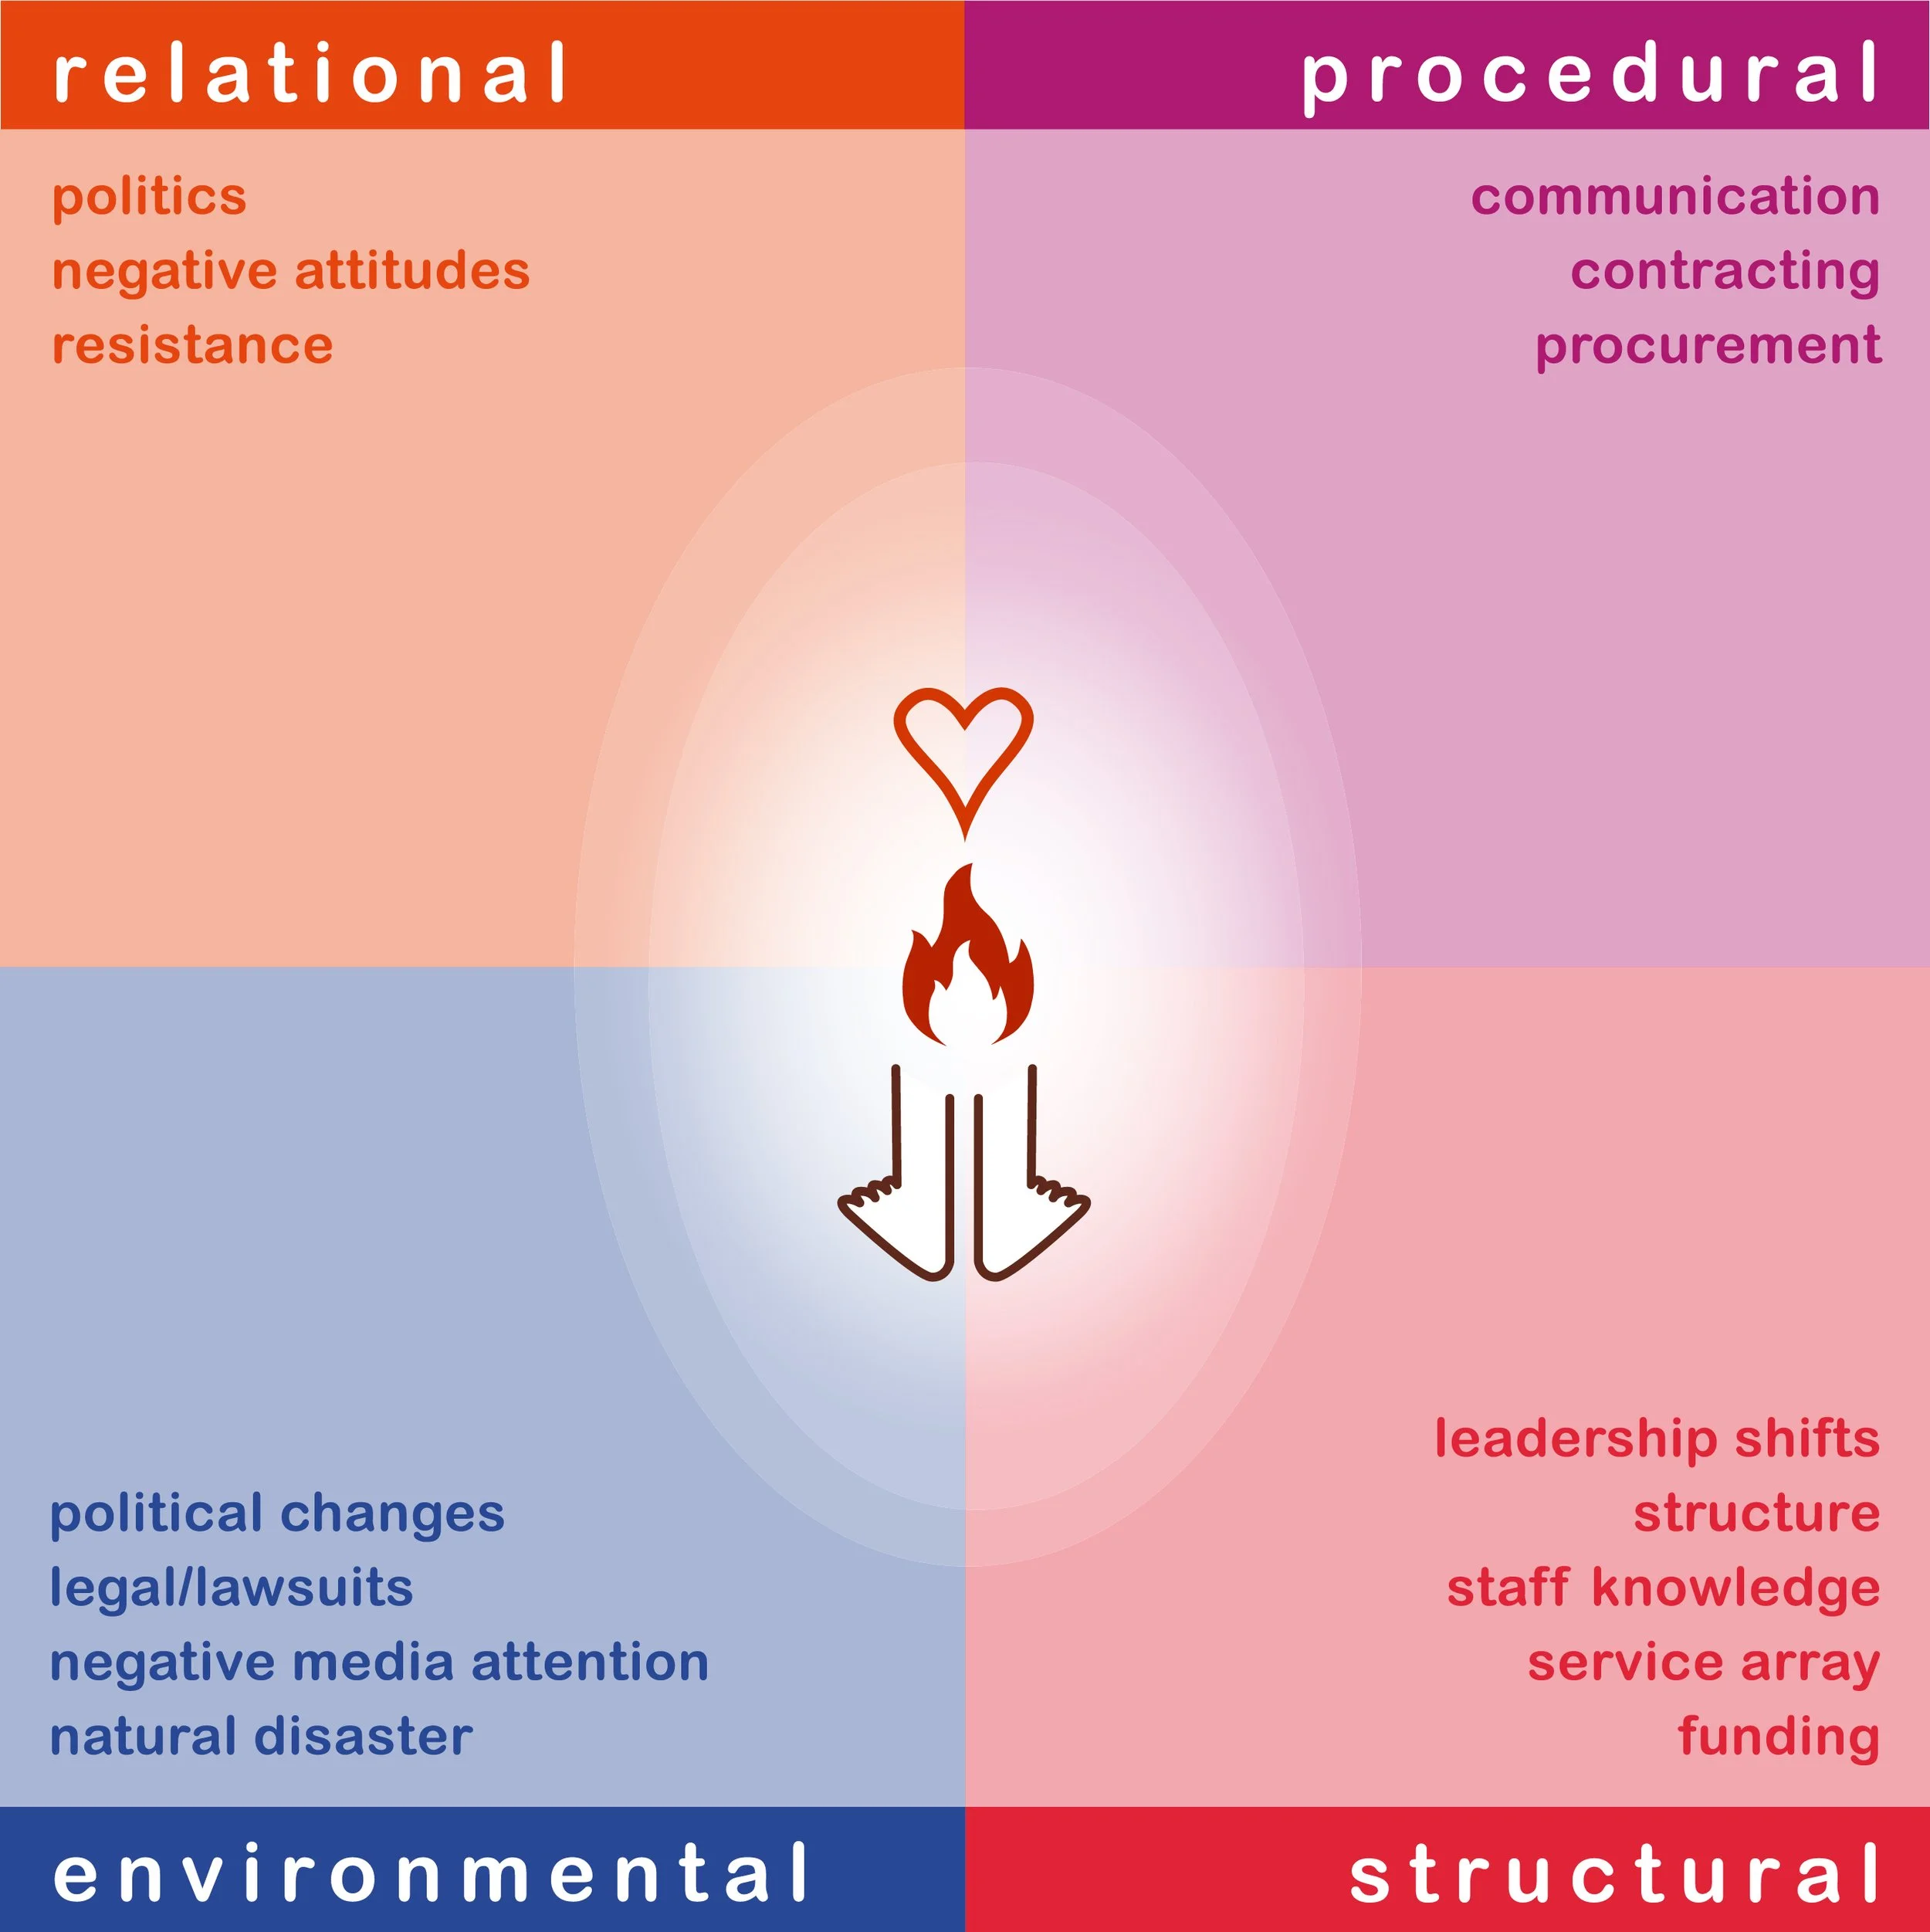
Constraints (headings, and sub-bullets which include the specific constraints)
Environmental
Political changes
Legal/lawsuits
Negative media attention
Natural disaster
Structural
Leadership shifts
Government structure
Government staff knowledge
Provider service array
Funding
Interpersonal/Relational
Politics
Negative attitudes/resistance
Procedural
Communication
Contracting and procurement
Strategies
Relationships
Visioning
Maximizing the environment
Financing
Policy and legislation
Service development
Education and workforce development
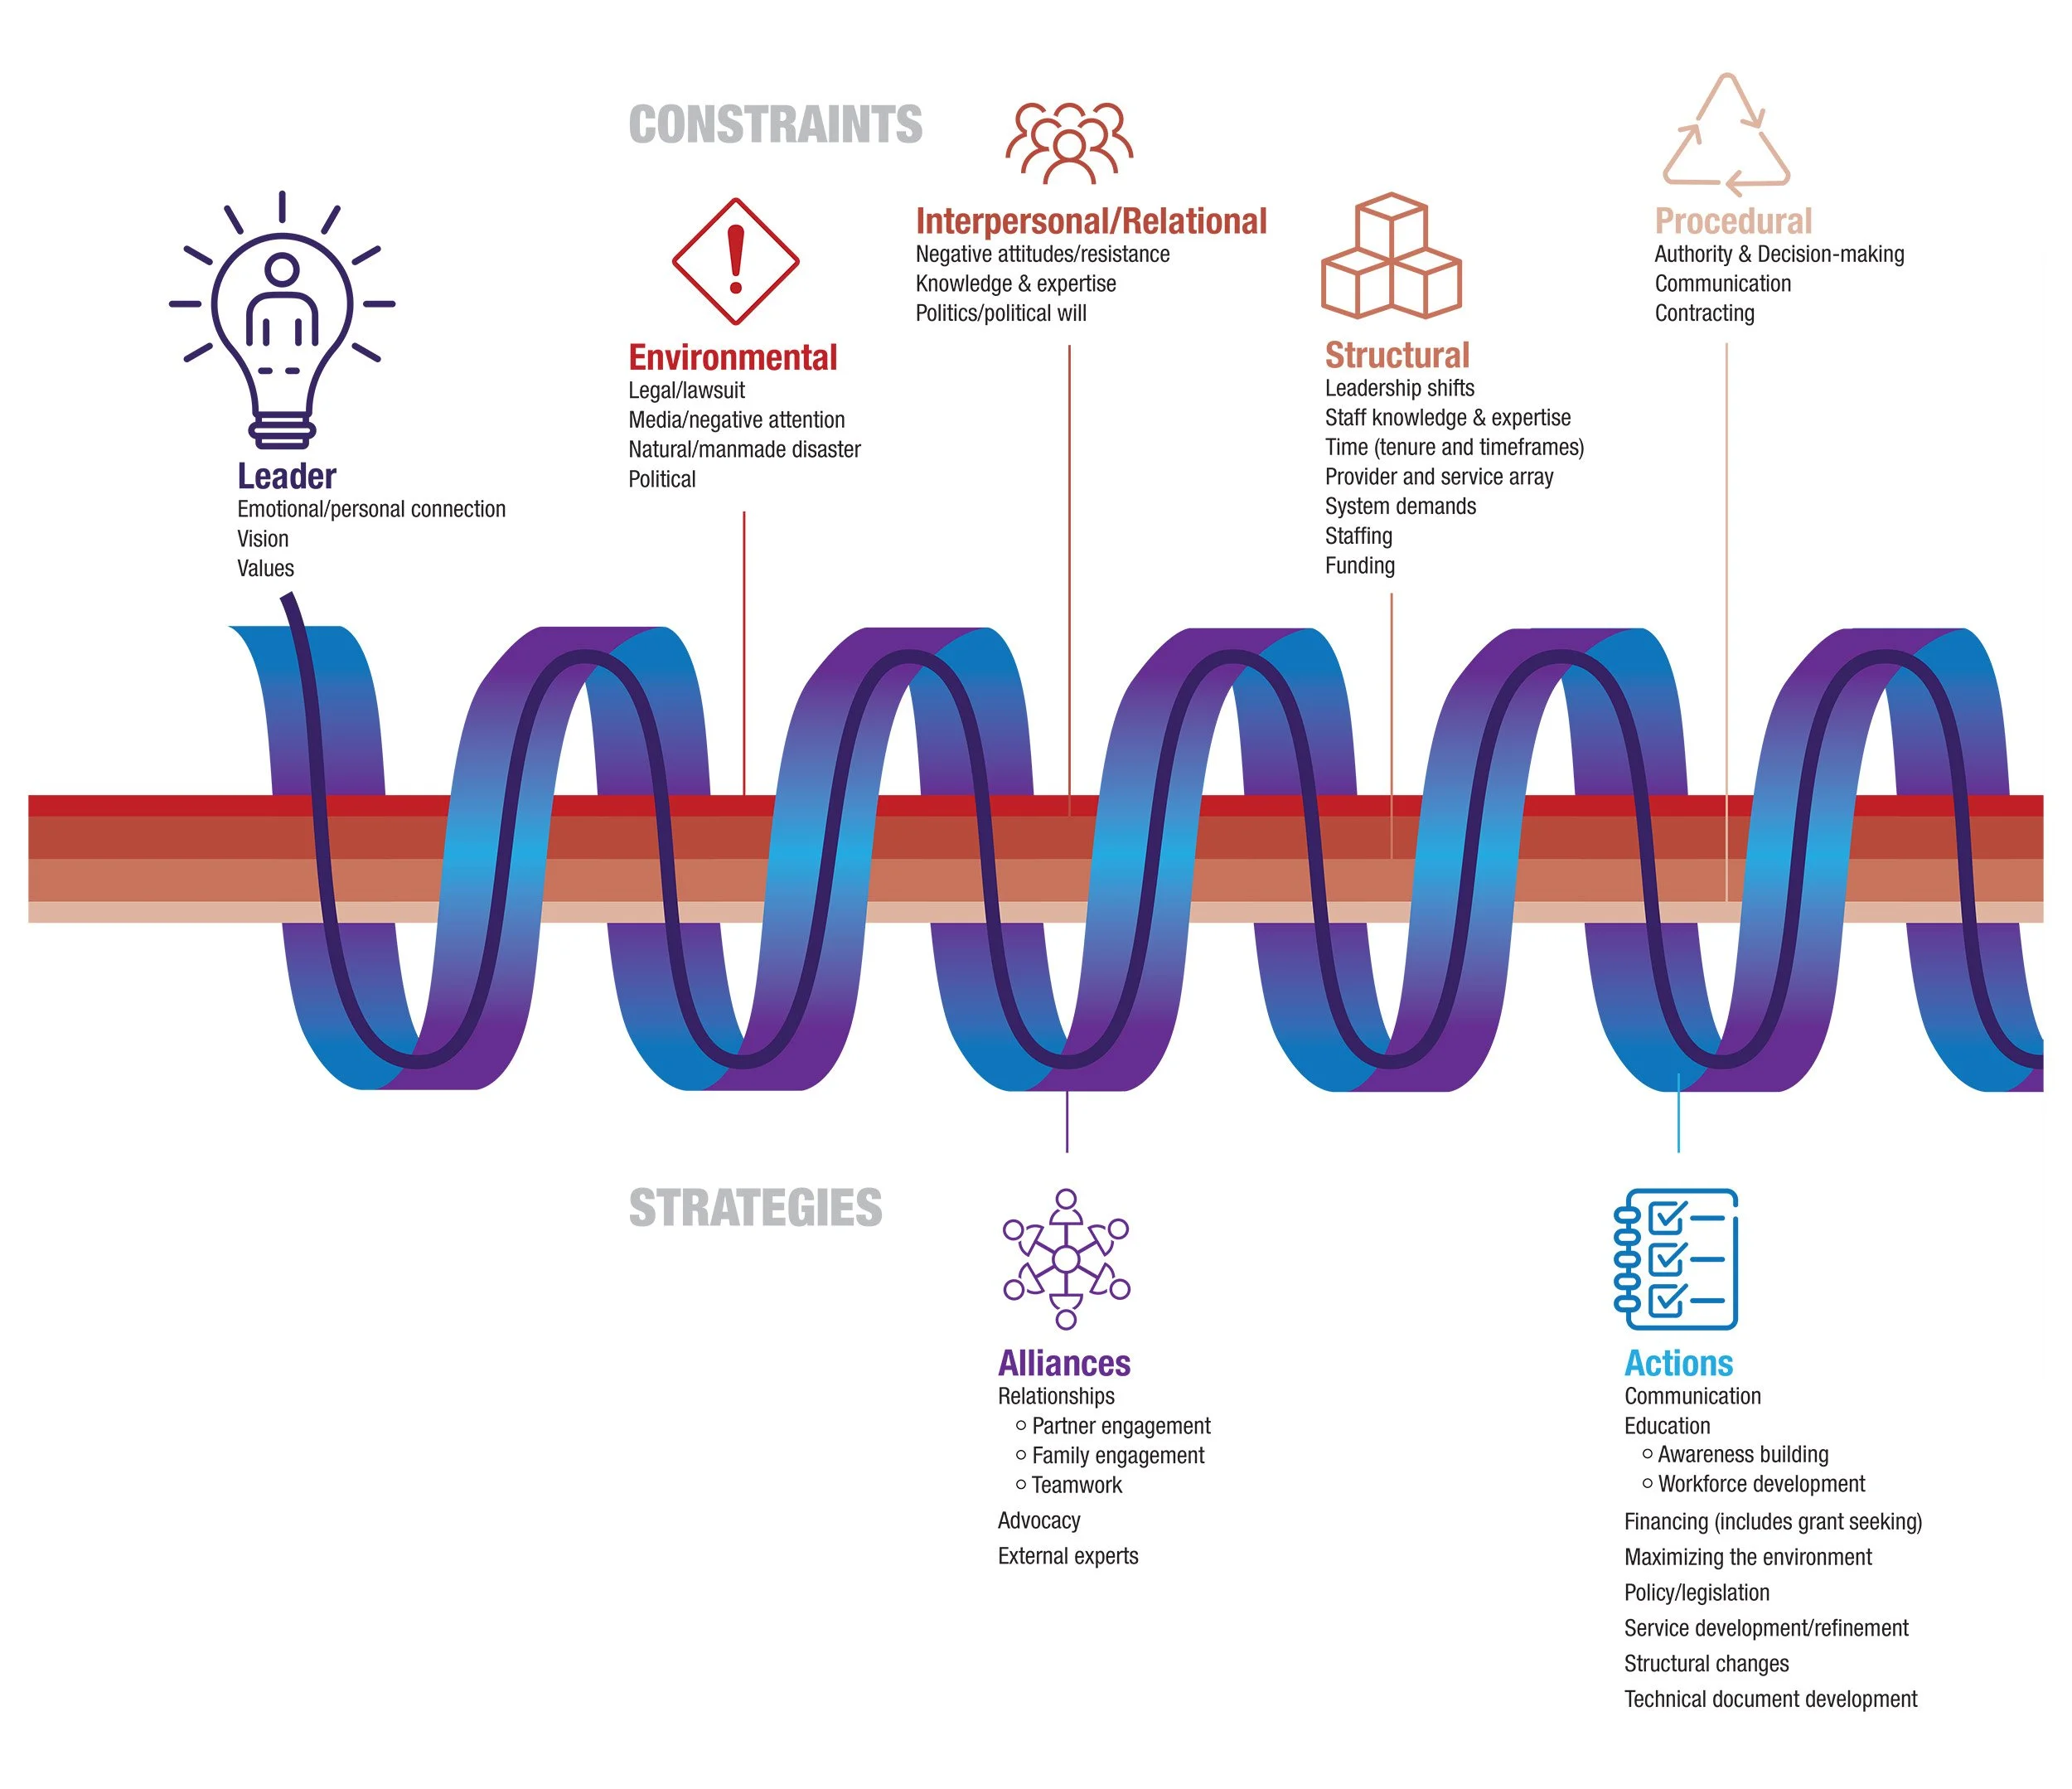
The client also had a visual model from an earlier attempt that she was able to share with me:
While this model didn’t fully satisfy the client’s vision, it did move us along in our process significantly. The colors and the visual language of icons would stay with us. The central shape of the sign wave felt too linear for the model, so we would end up focusing on the notion of a square image that moved from the center outward, rather than reading linearly from left to right.
Concept Exploration
Because our model was primarily intended to support live presentation via slideshow, the design needed to be modular so individual elements could be removed in order to highlight specific content for each phase of the presentation.

The client visualized the research as pathways that could be explored from an initial point. We decided to anchor the viewer, almost like a map, with feet at the center. The fire represents drive and passion, and the heart emphasizing the importance of love as a core force motivating leadership. This gave us the central graphic above.
My first attempt at a full visualization of the information followed:
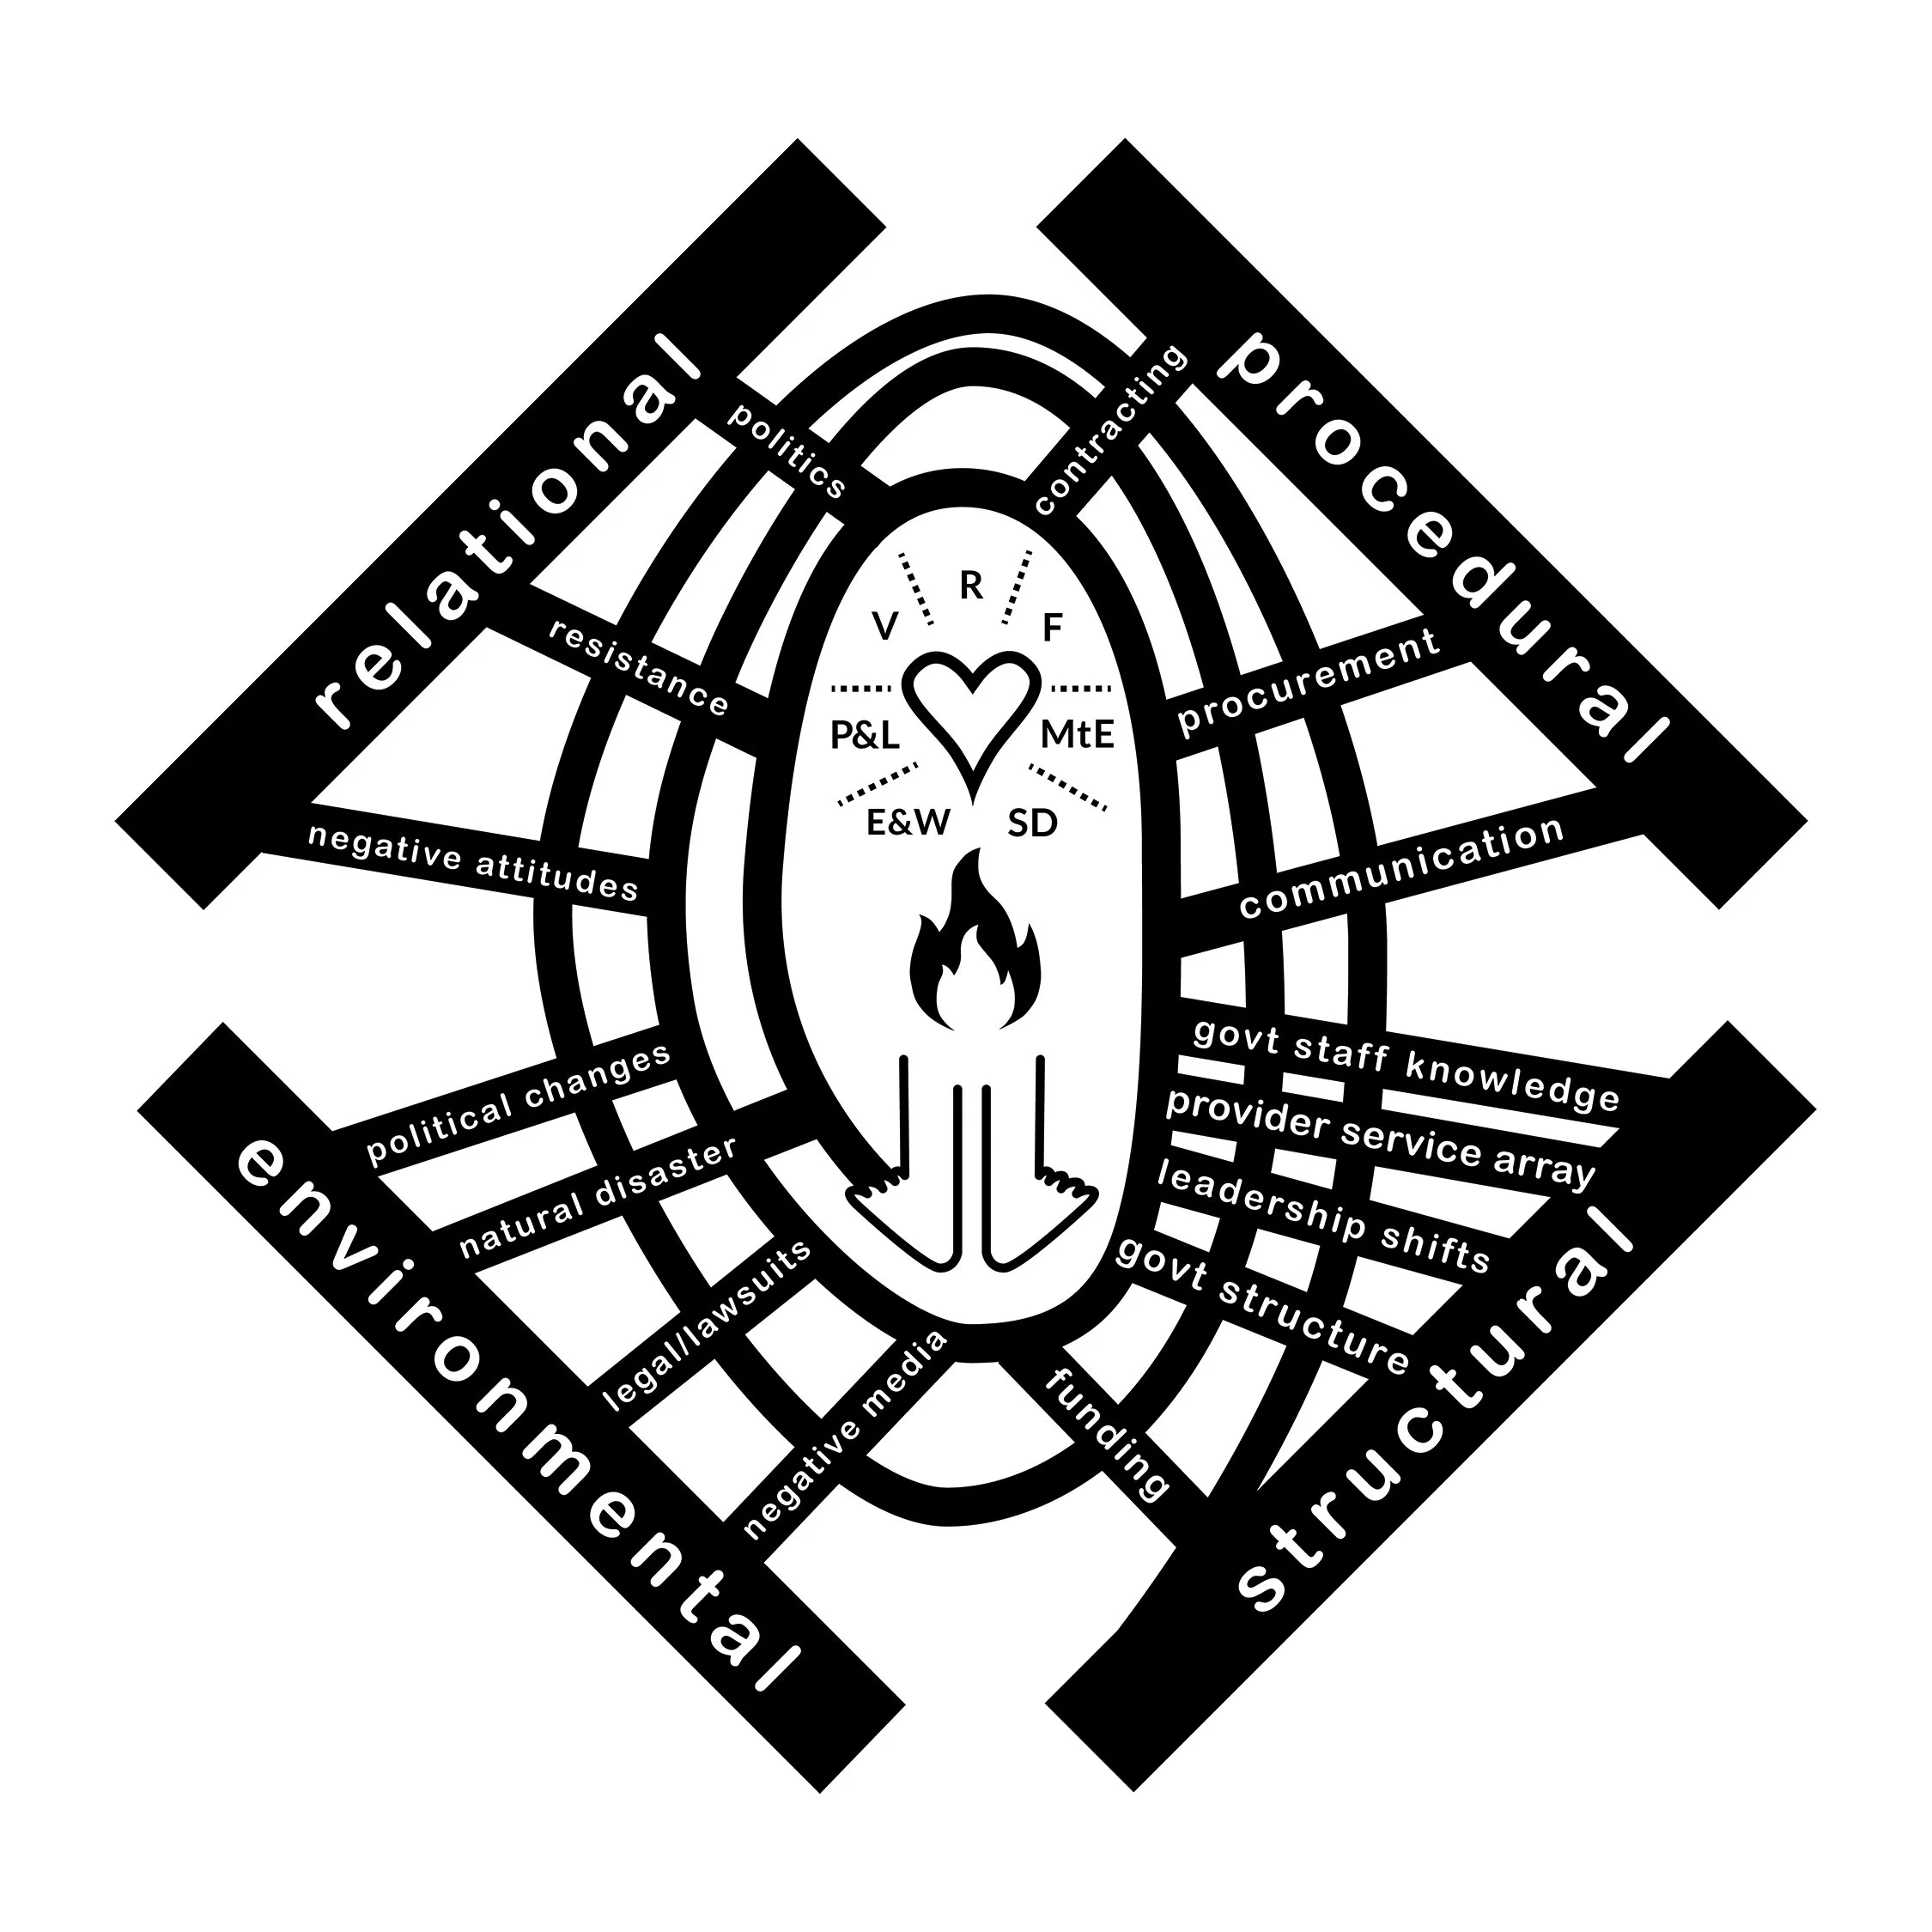
The client felt that we were onto something, and offered some helpful critical feedback:
I understand the spiral is the motion through the constraints, but I wasn’t really seeing that at first. It also looks like it ends in “structural.” I actually think it needs to sort of end by bleeding into all 4 as they are constant and ongoing (one of the findings)
The strategies inside the circle just being letters is really hard…as no one will know what those letters mean…so I think we need to somehow show the words – which I get is really challenging because there are so many of them
The spiral being sort of odd shaped was also sort of “meh” for me…could it be thinner and have more spirals and be more symmetrical…not really sure what I am after here, but I wasn’t feeling that piece as much.
Refinement
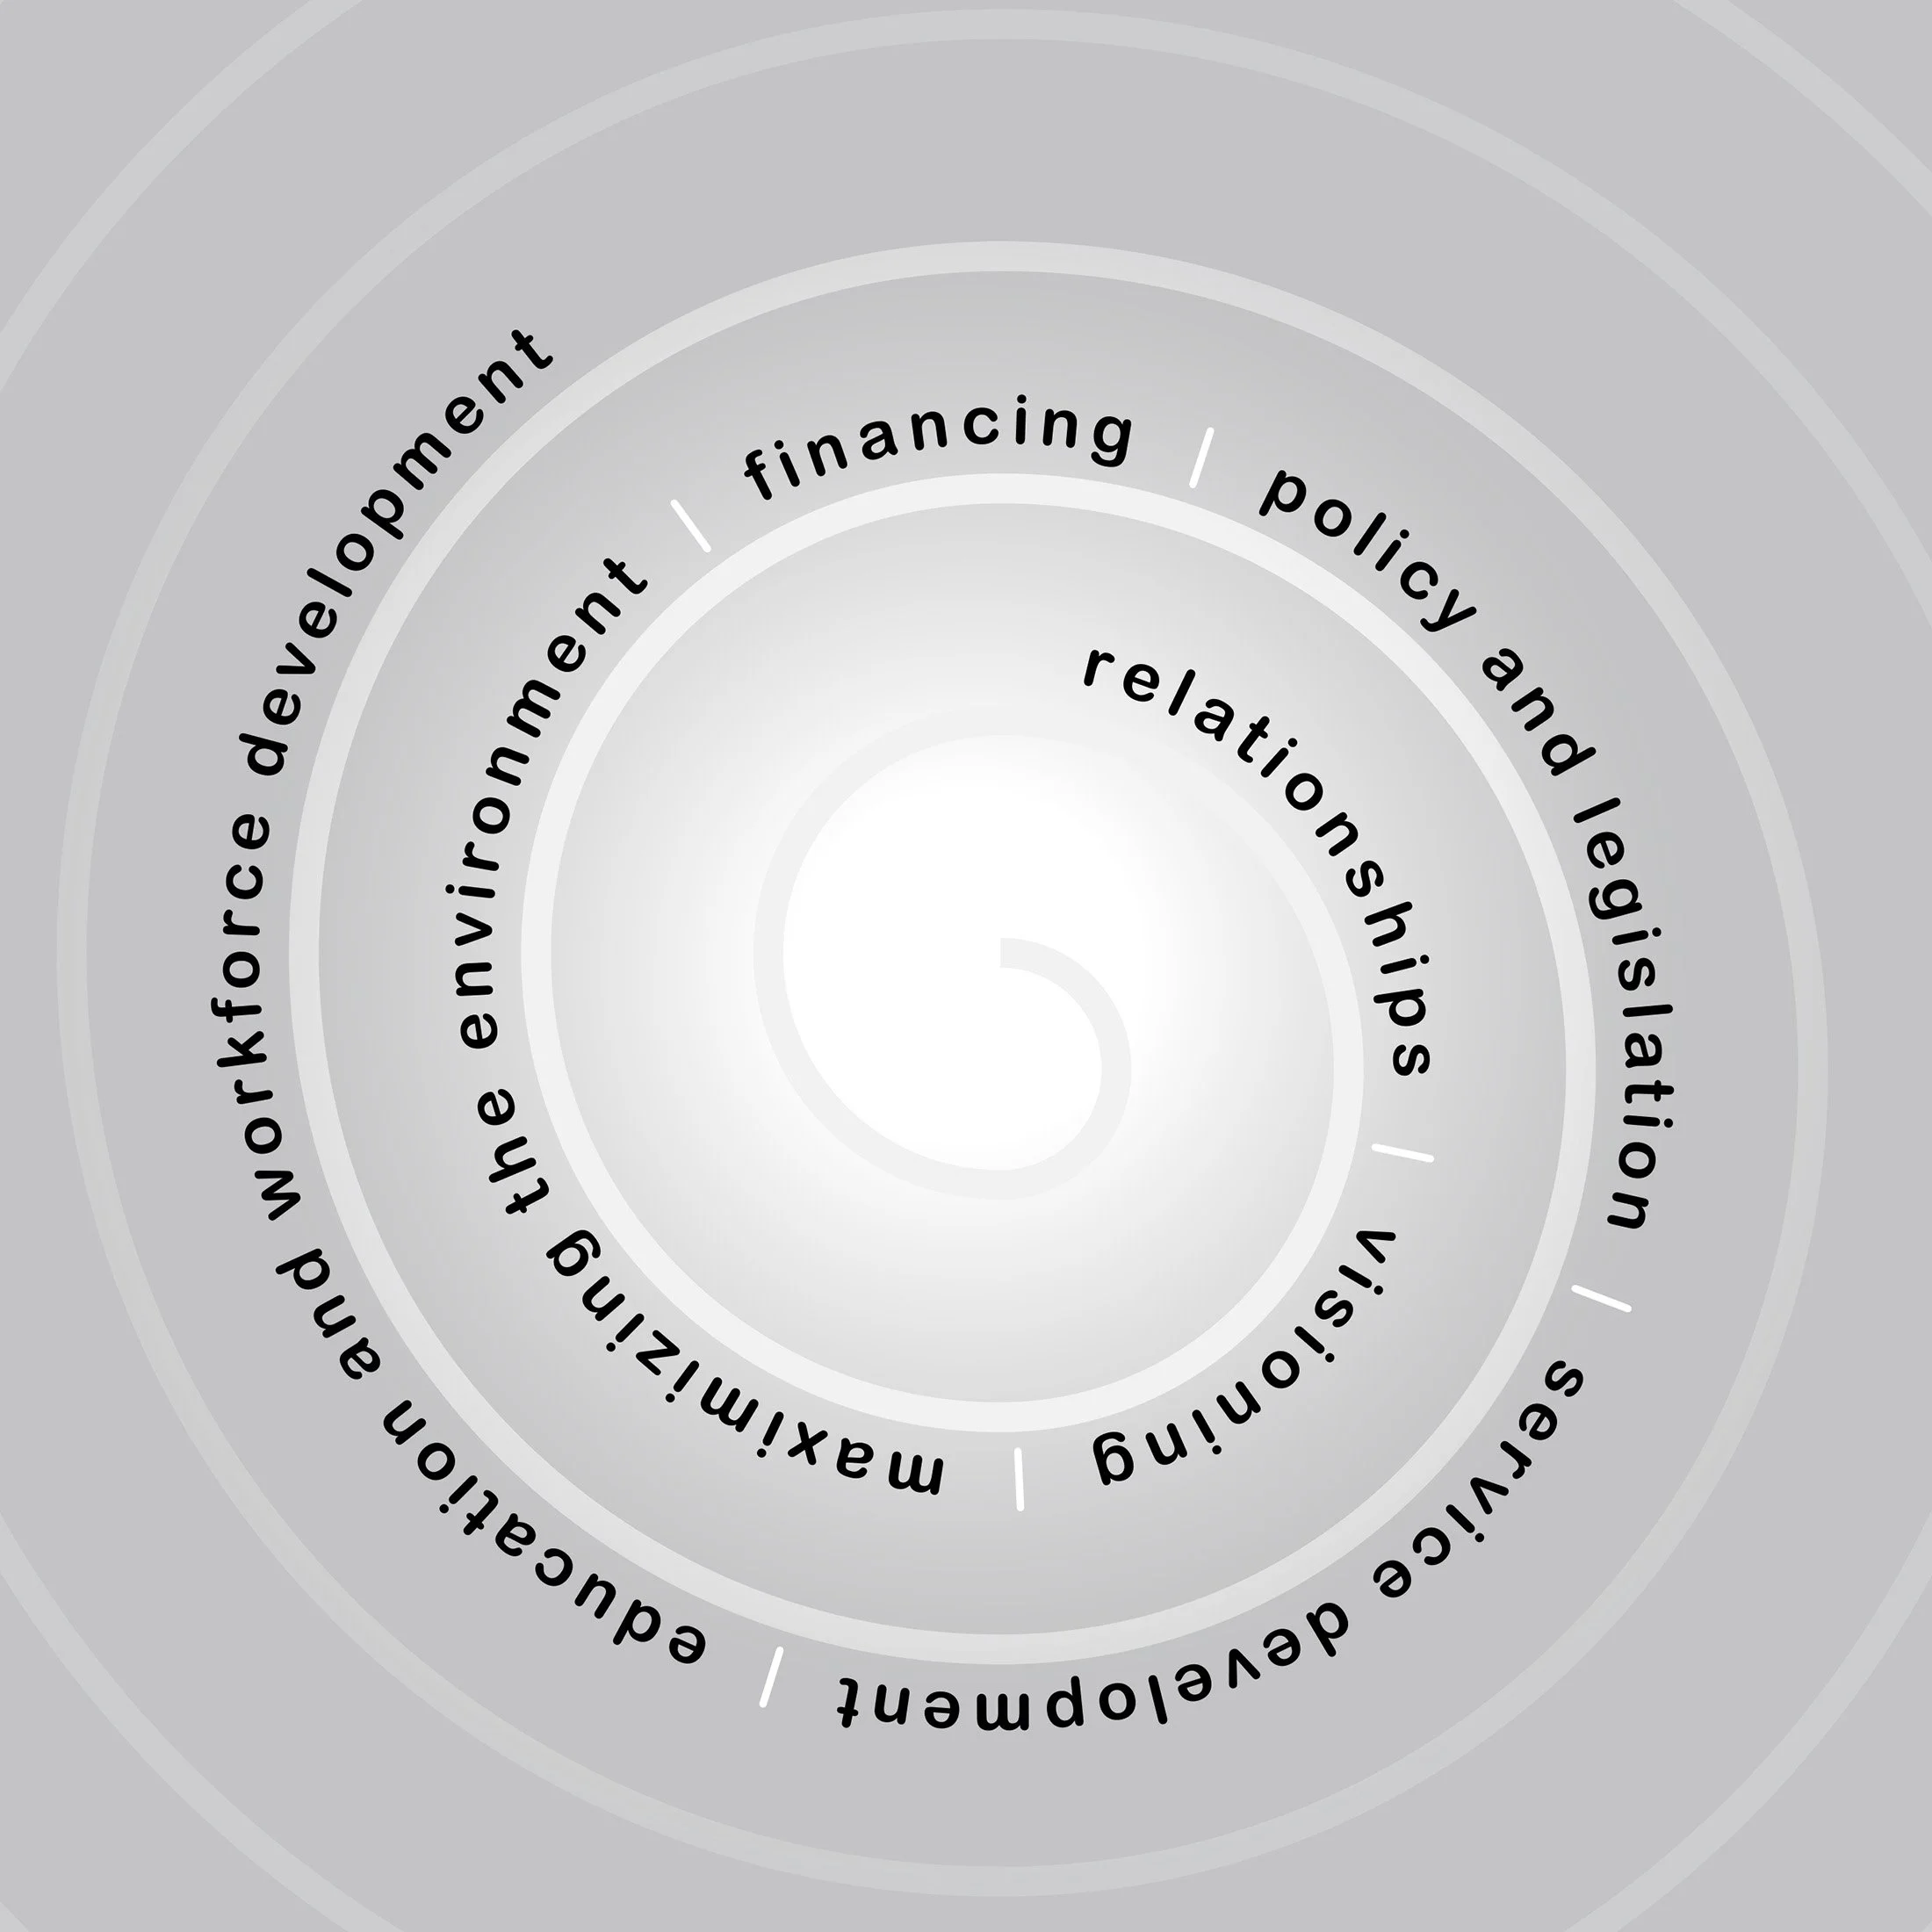
Based on the helpful feedback, we arrive at precise visualizations of each element:
The spiral path of leadership given more symmetry and balance within the frame, with the constraints on leadership included as part of the process of growth:
The leader navigating this spiral journey:
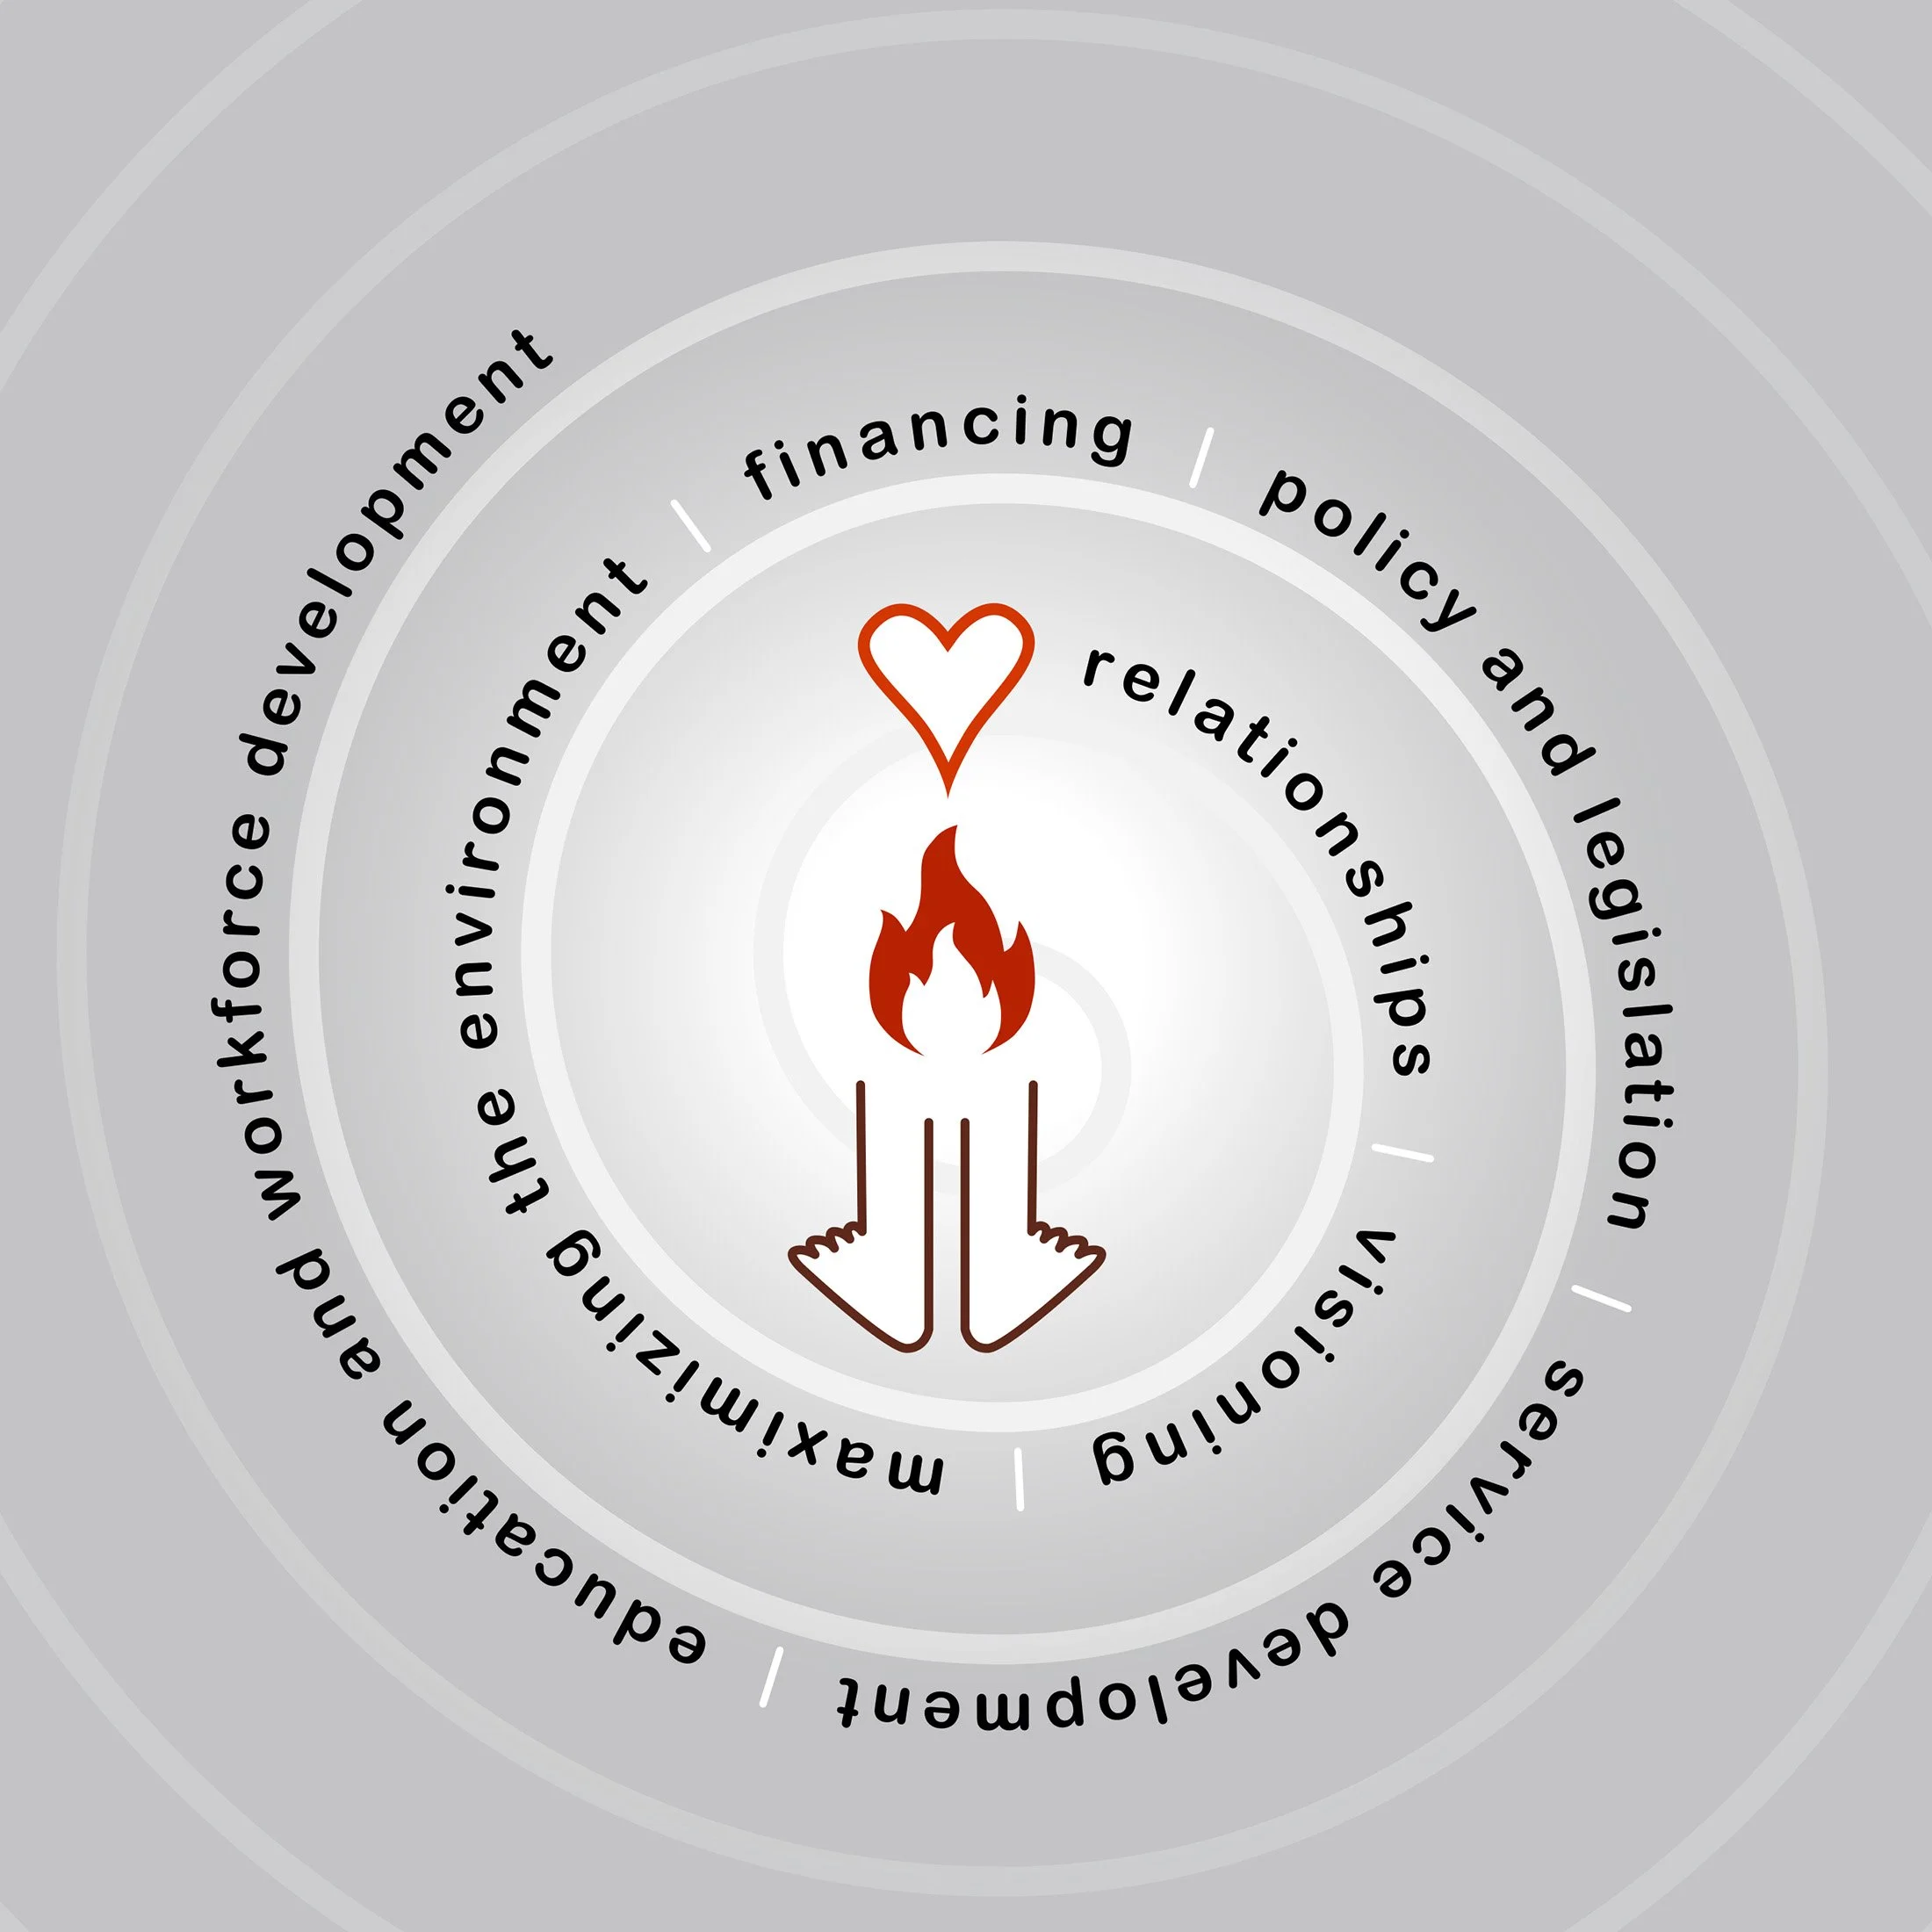
…and the quadrants the leader moves through:
And the complete model, with all dimensions:
Outcomes & Reflection
The complexity of information that this model required, and the modular structure needed for presentation, made this project a very stimulating challenge.