
Case Study: Research Visualization
Let’s explore my collaboration with Harriet L. Schwartz and Elizabeth L. Holloway on the publication of their book Essentials of Constructivist Critical Incident Technique.
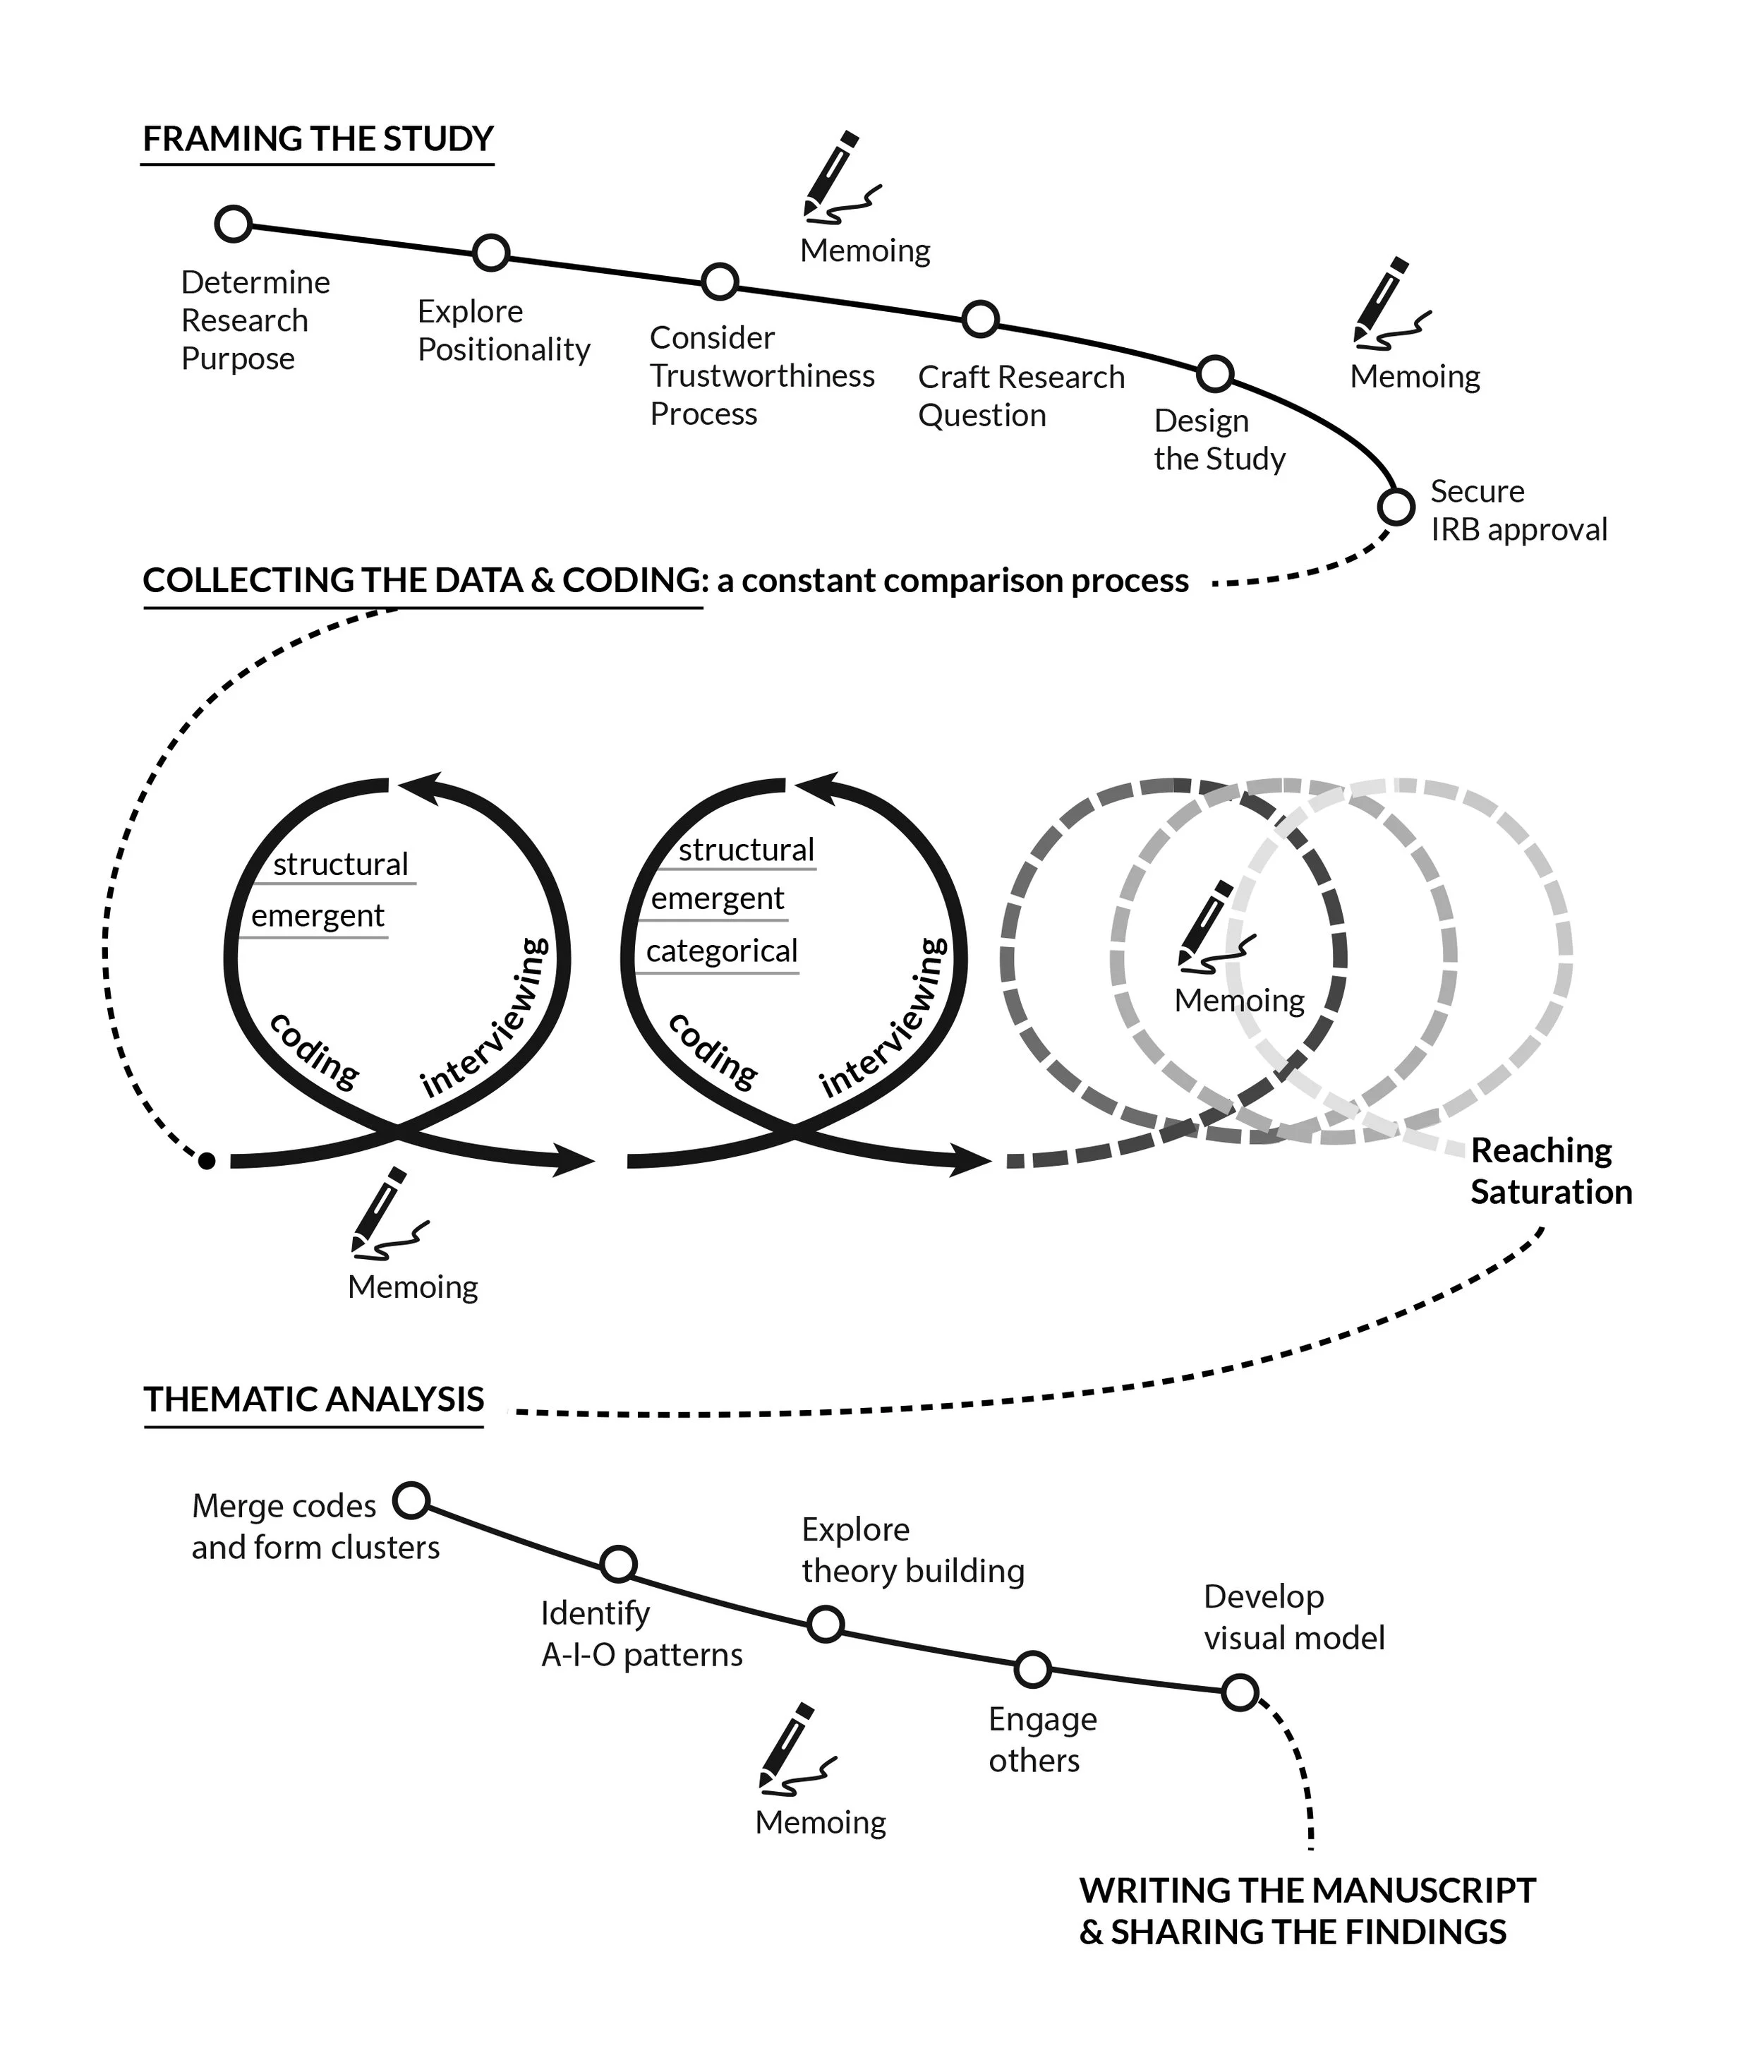
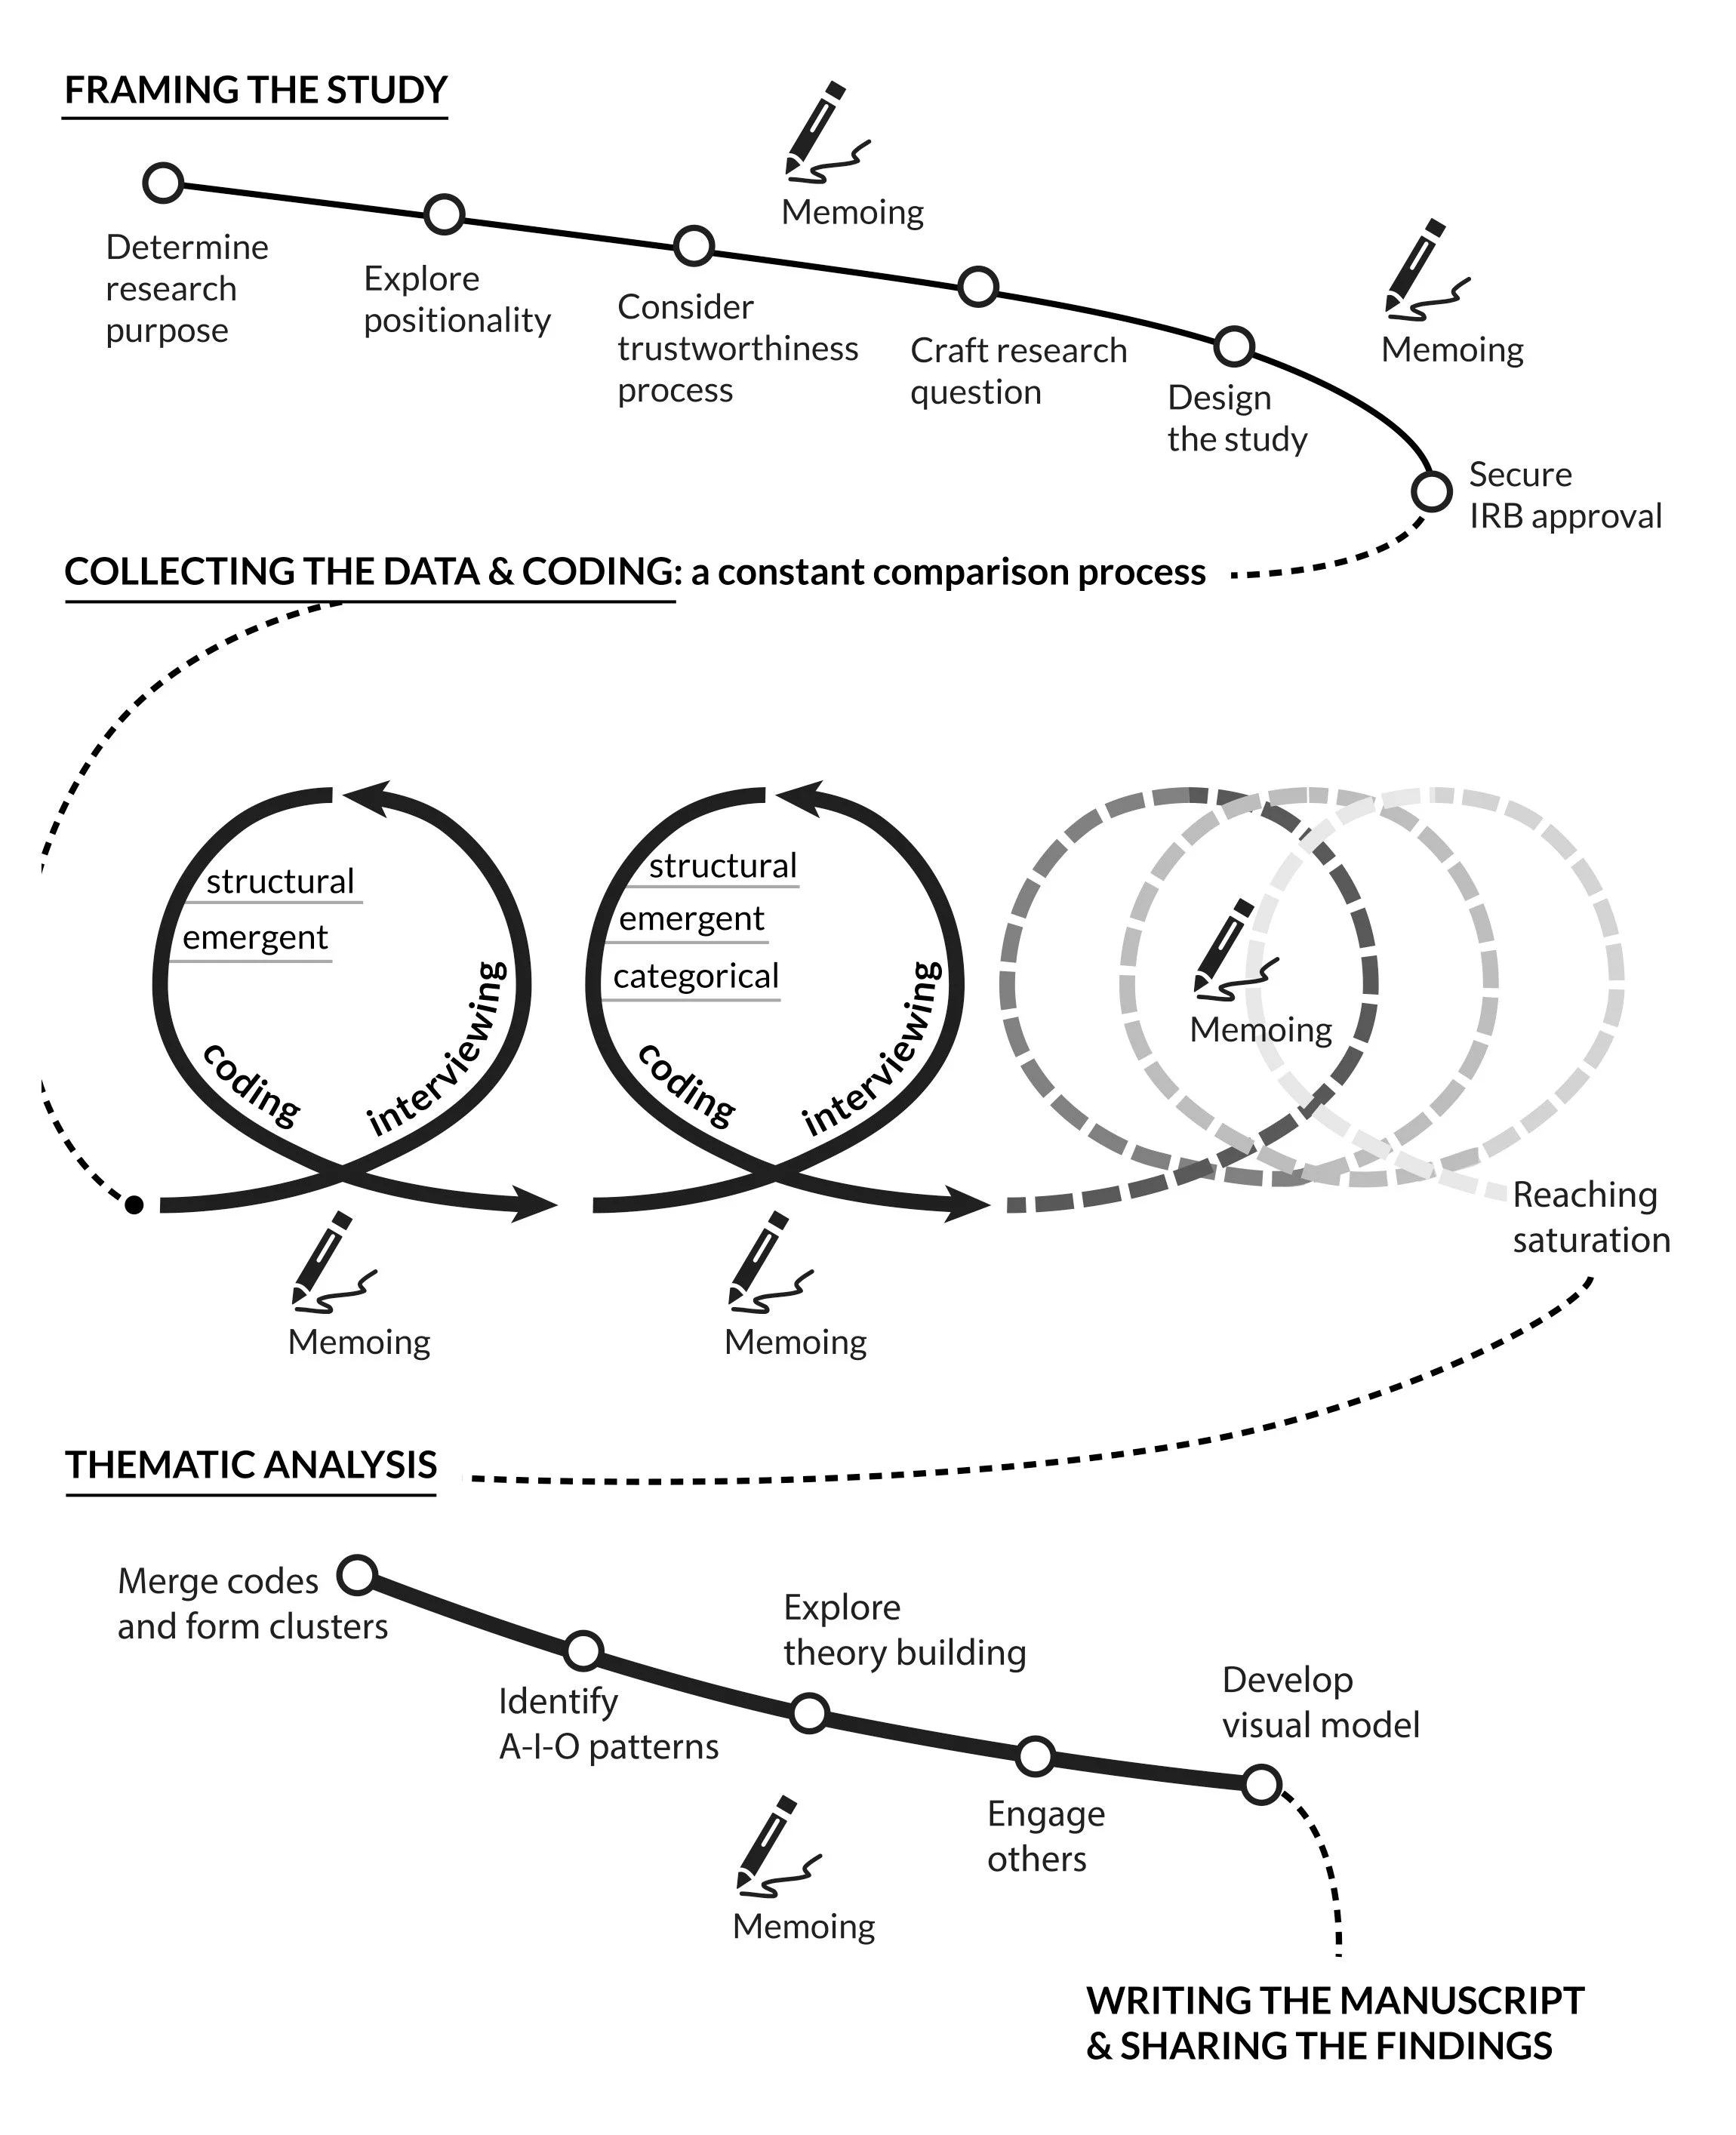
Our collaboration resulted in a suite of elegant diagrams encapsulating the complex processes articulated in their research. Here’s one example:
*all images are copyright 2024 Schwartz and Holloway. All rights reserved.
The Challenge
“We are hard at work on a book on another research method -- critical incident technique,” wrote the clients. “We'd like to include one or two figures in the final manuscript. One would be an overview of the method and would be something like the one you did for us regarding grounded theory (though not quite as complex) and the second one, much more simple.
Thanks for considering this!”
As you can see, I’d already worked with this research team with great success. I was excited to dive in with them. We found a mutual window to meet on Zoom, and the clients emailed over relevant pages of the research.
Critical Incident Technique is an analysis with a broad scope and many moving parts. The central challenge of the work consisted of:
a) developing a working understanding of the research
b) defining the visual and typographic language that would both suit the project and adhere to the publisher’s requirements
and
c) find a way to iterate on the design process that would allow the client to provide guidance in the refining of visual forms
Quite the quandary, but these paradoxes are what light me up about this work. With our objective clarified, it was time to dig in…
Discovery & Research
The clients organized their research in phases, which they communicated via text. Here’s a snippet of the communication:
Phase 1
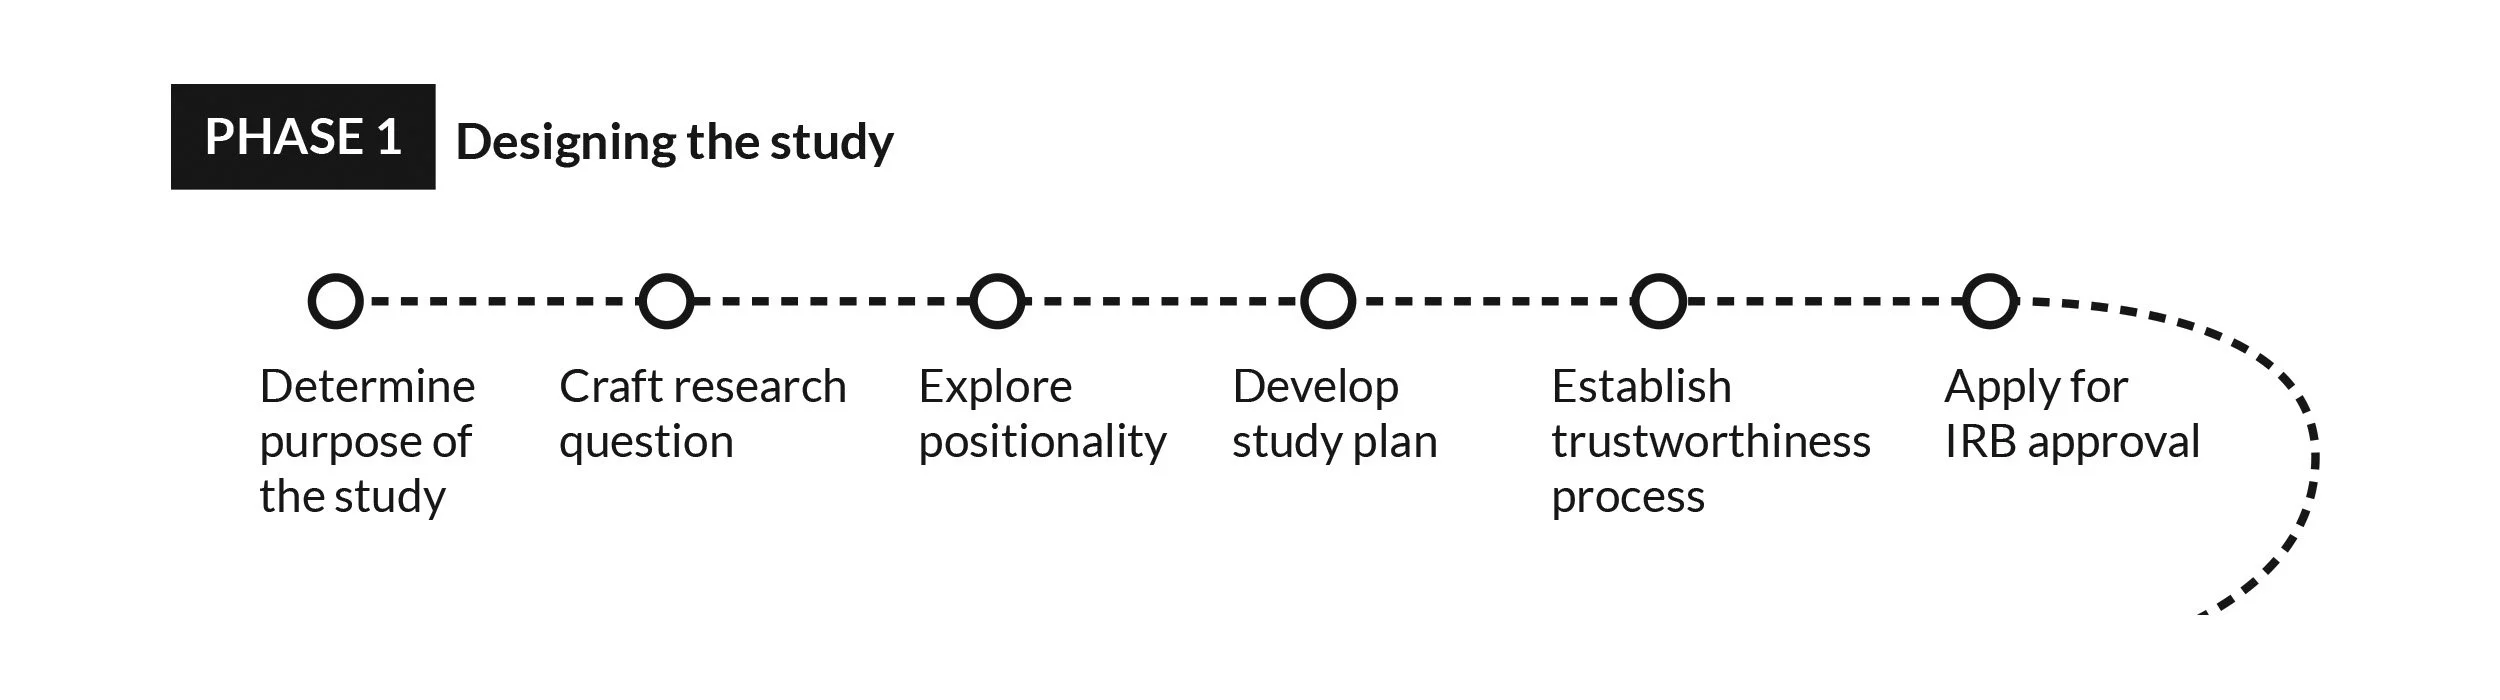
You begin the process by determining the purpose of the study and then you craft the research question. Next you explore your positionality (Adam – this is one’s social location and lenses). Next you develop a study plan and establish a trustworthiness process. And then you apply for Institutional Review Board (IRB) approval to move forward with the study.
Phase 2
After approval, you begin collecting data and soon move into the early conceptual work. ((This is the most dynamic part of the process)). You will do your first interview, code the transcript, and then do one or two more interviews and code. You continue this dynamic process of interviewing and coding and soon will begin to see connections within the data. You continue this dynamic process of interviewing and coding until you reach saturation and stop collecting data…
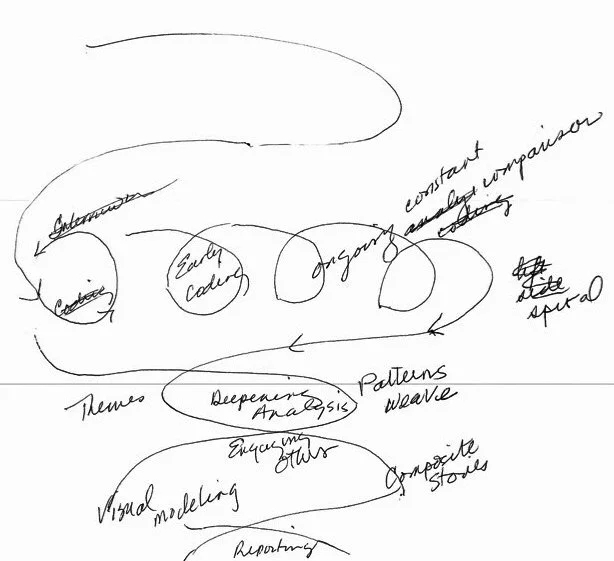
The client also provided both loose sketches of how they imagined the visual forms…
…as well as digital mockups of the information flows:
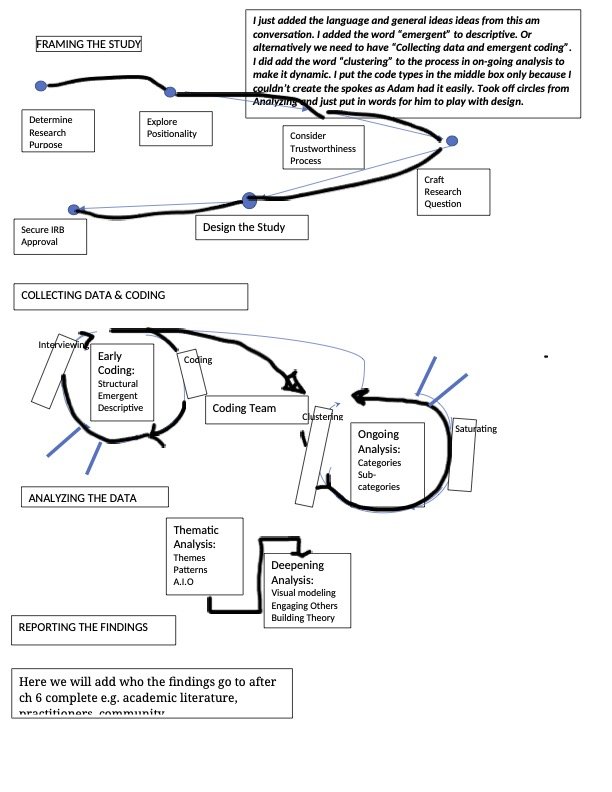
Their clarity in communicating the essentials of the research helped me expedite my comprehension, which allowed me to move quickly into the visual design exploration.
Concept Exploration
I began by providing drafts of each Phase of the research process. Here’s the first draft of Phase 1:
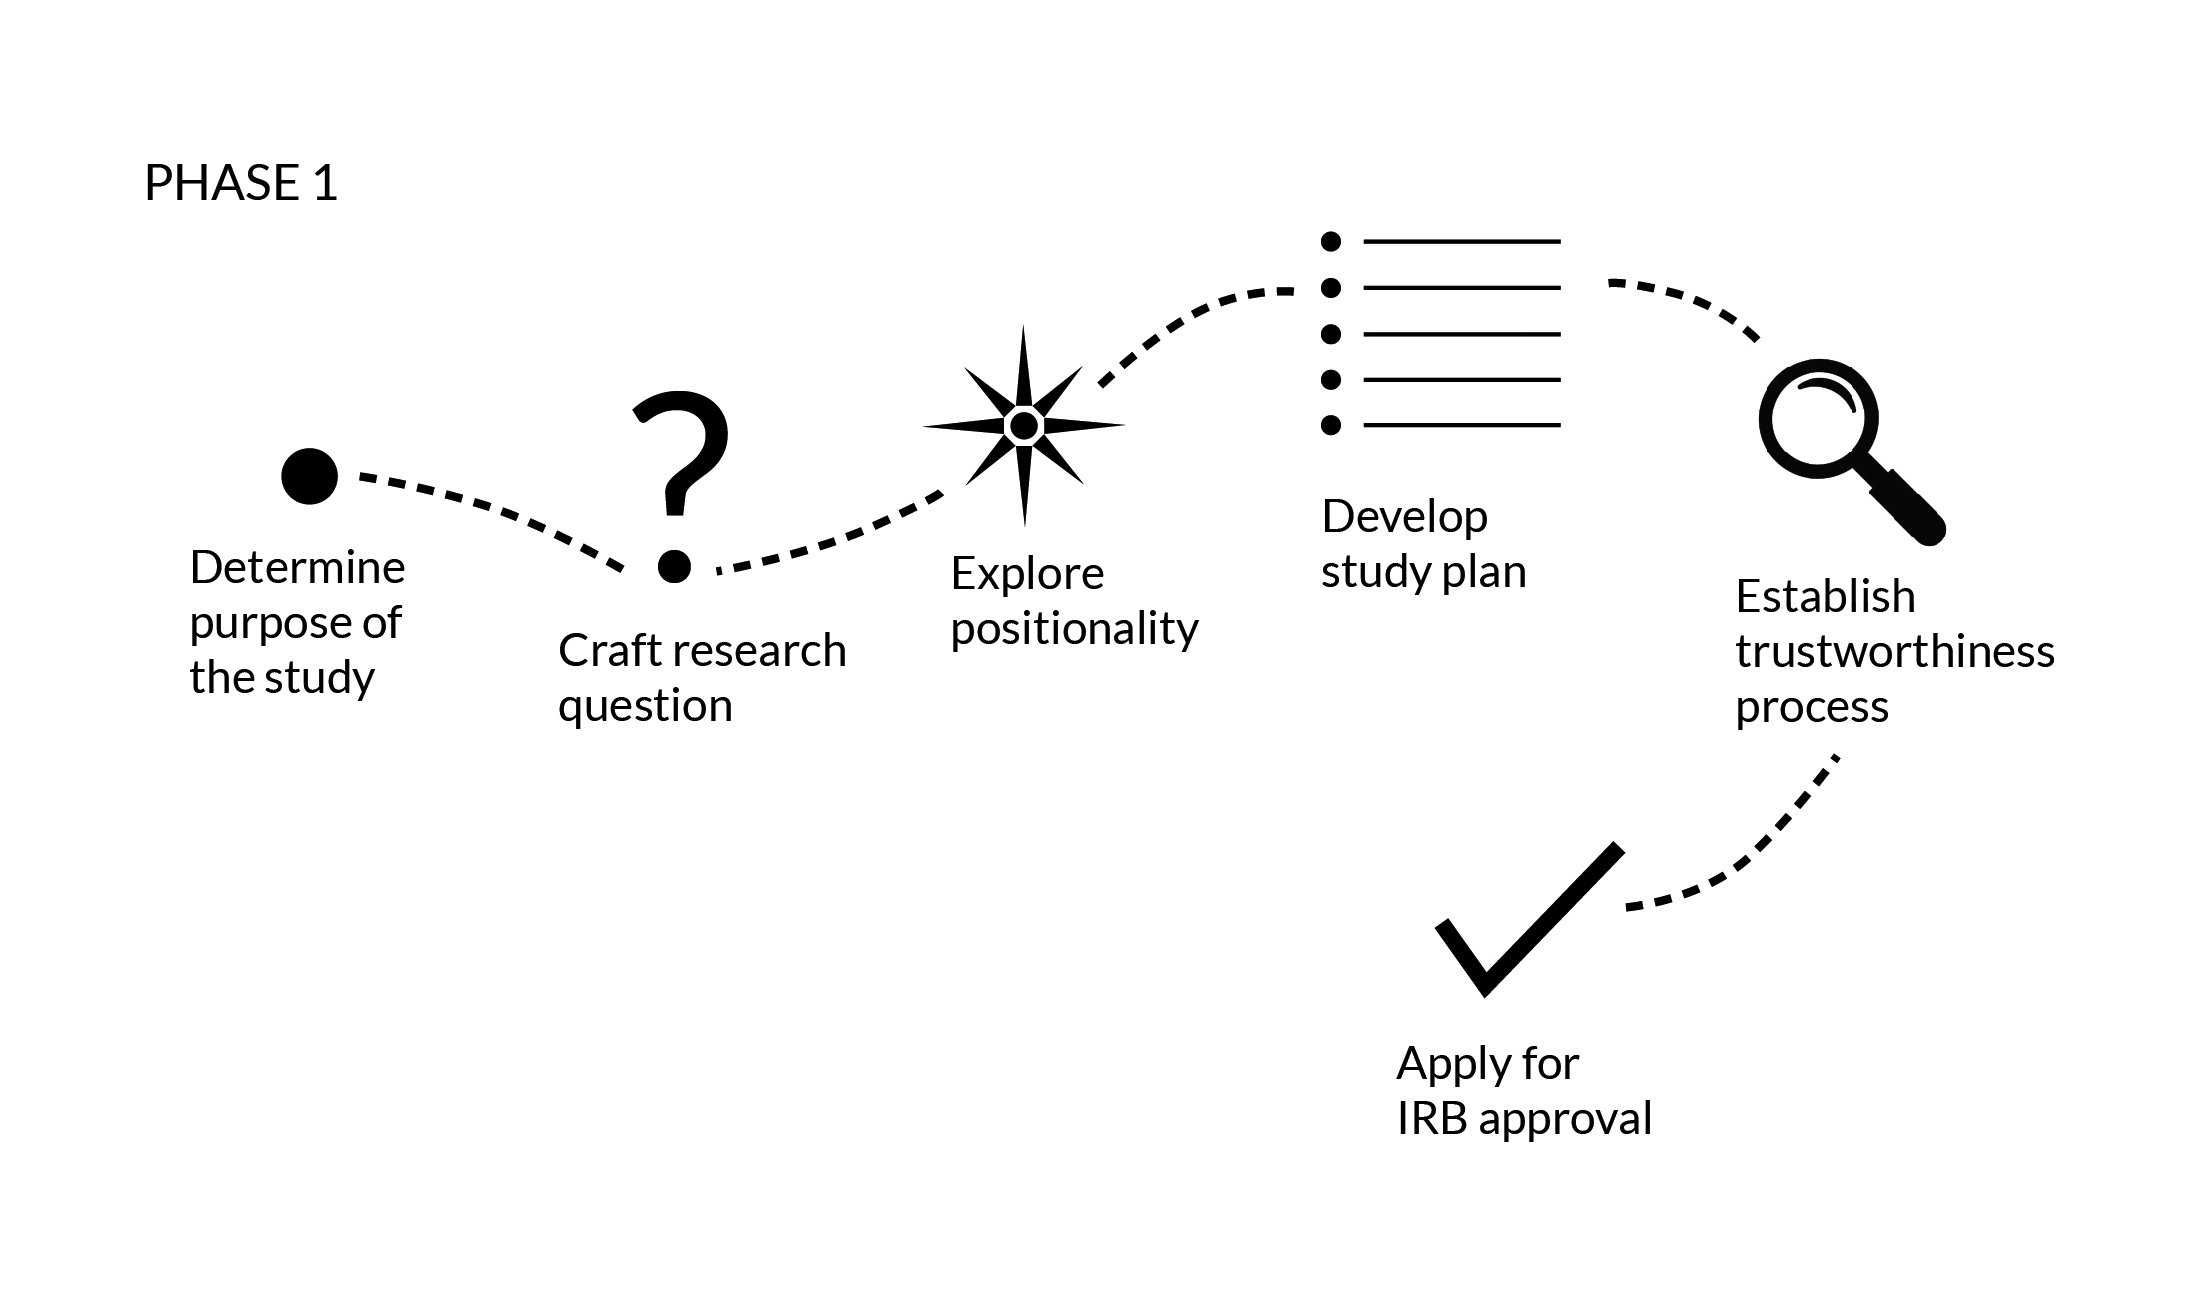
The feedback from the client was that the iconography was too varied and distracting. The next draft eliminated the icons completely:
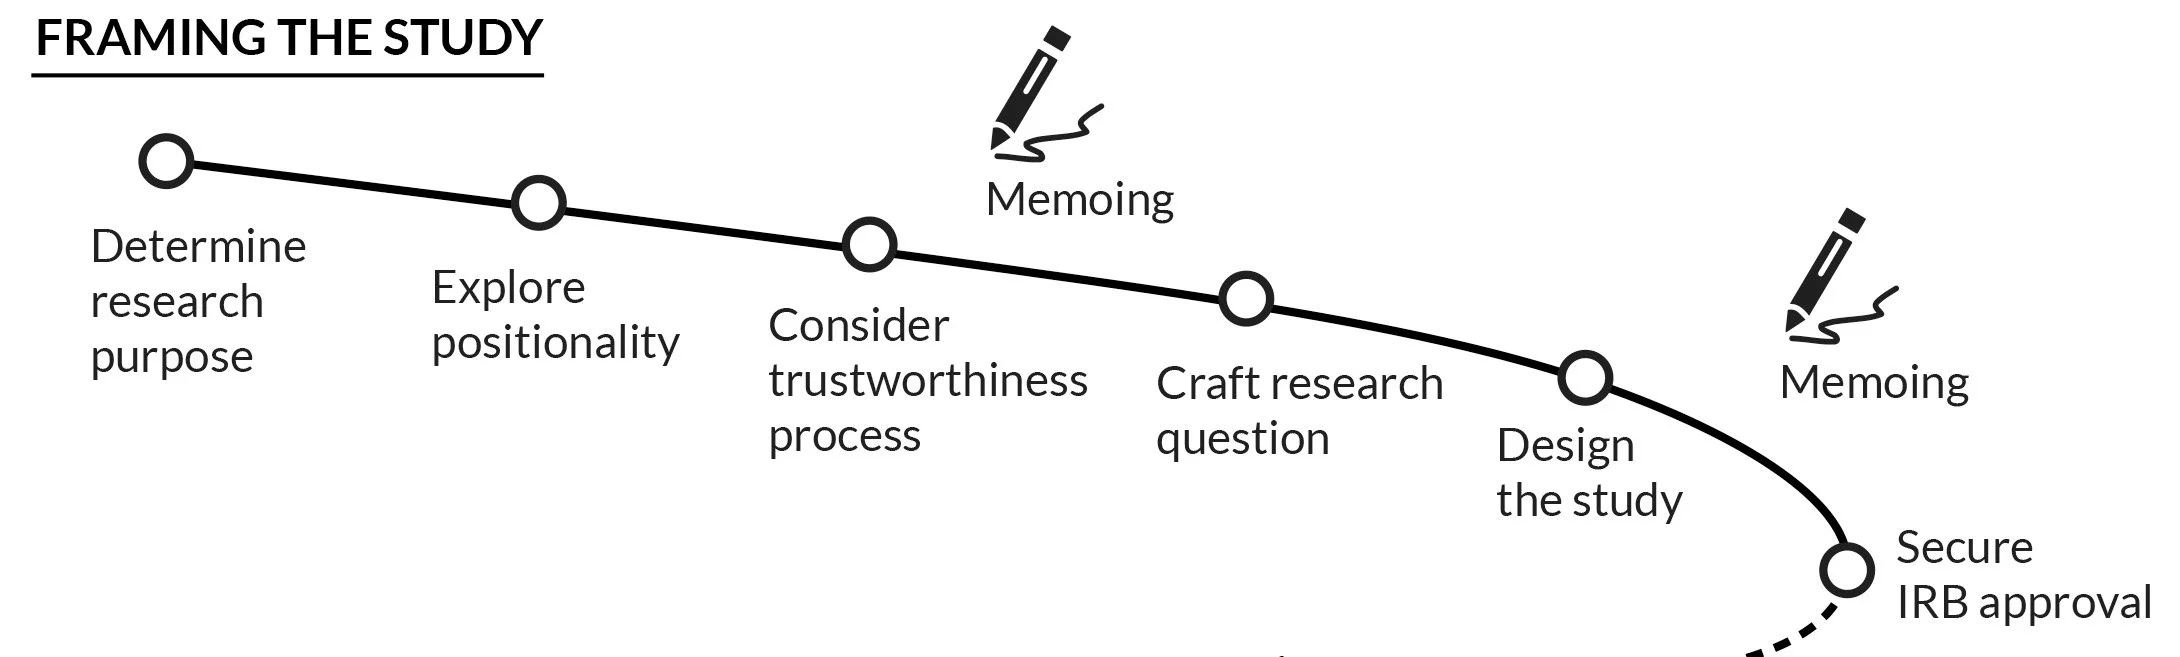
Ultimately, we would arrive at a hybrid solution, the “memoing” icons provide visual interest and a way of articulating secondary processes. The process of iterating on the visual form also allowed the clients to refine the language and order of steps. For example, “designing the study” becomes “framing the study,” creating subtle but important conceptual precision:
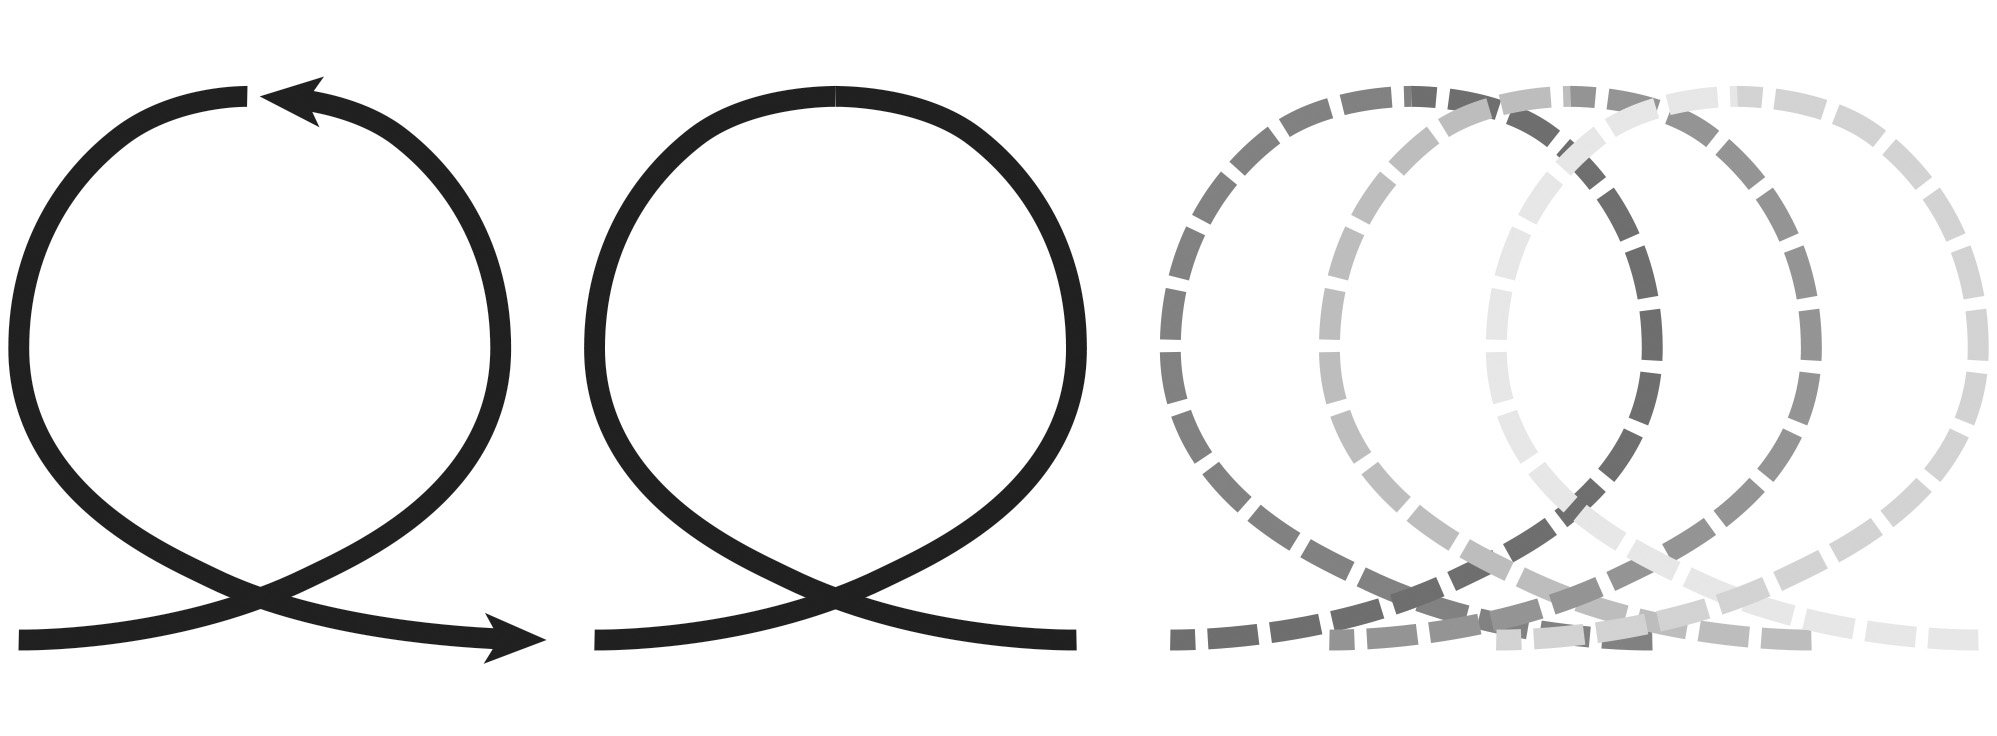
Finding ways to encompass the full process in a legible way on a single page was a great challenge. We needed to stay monochrome for the book publication, so I worked with grey tones to create the impression of time and hierarchy within the research process. A key facet of the client’s research model involved processes that were iterative, and also sequential. I spent some time practicing how to visualize this. I have design files that just explore loops:
Early drafts of the full composition look clunky in hindsight to me, like this one:
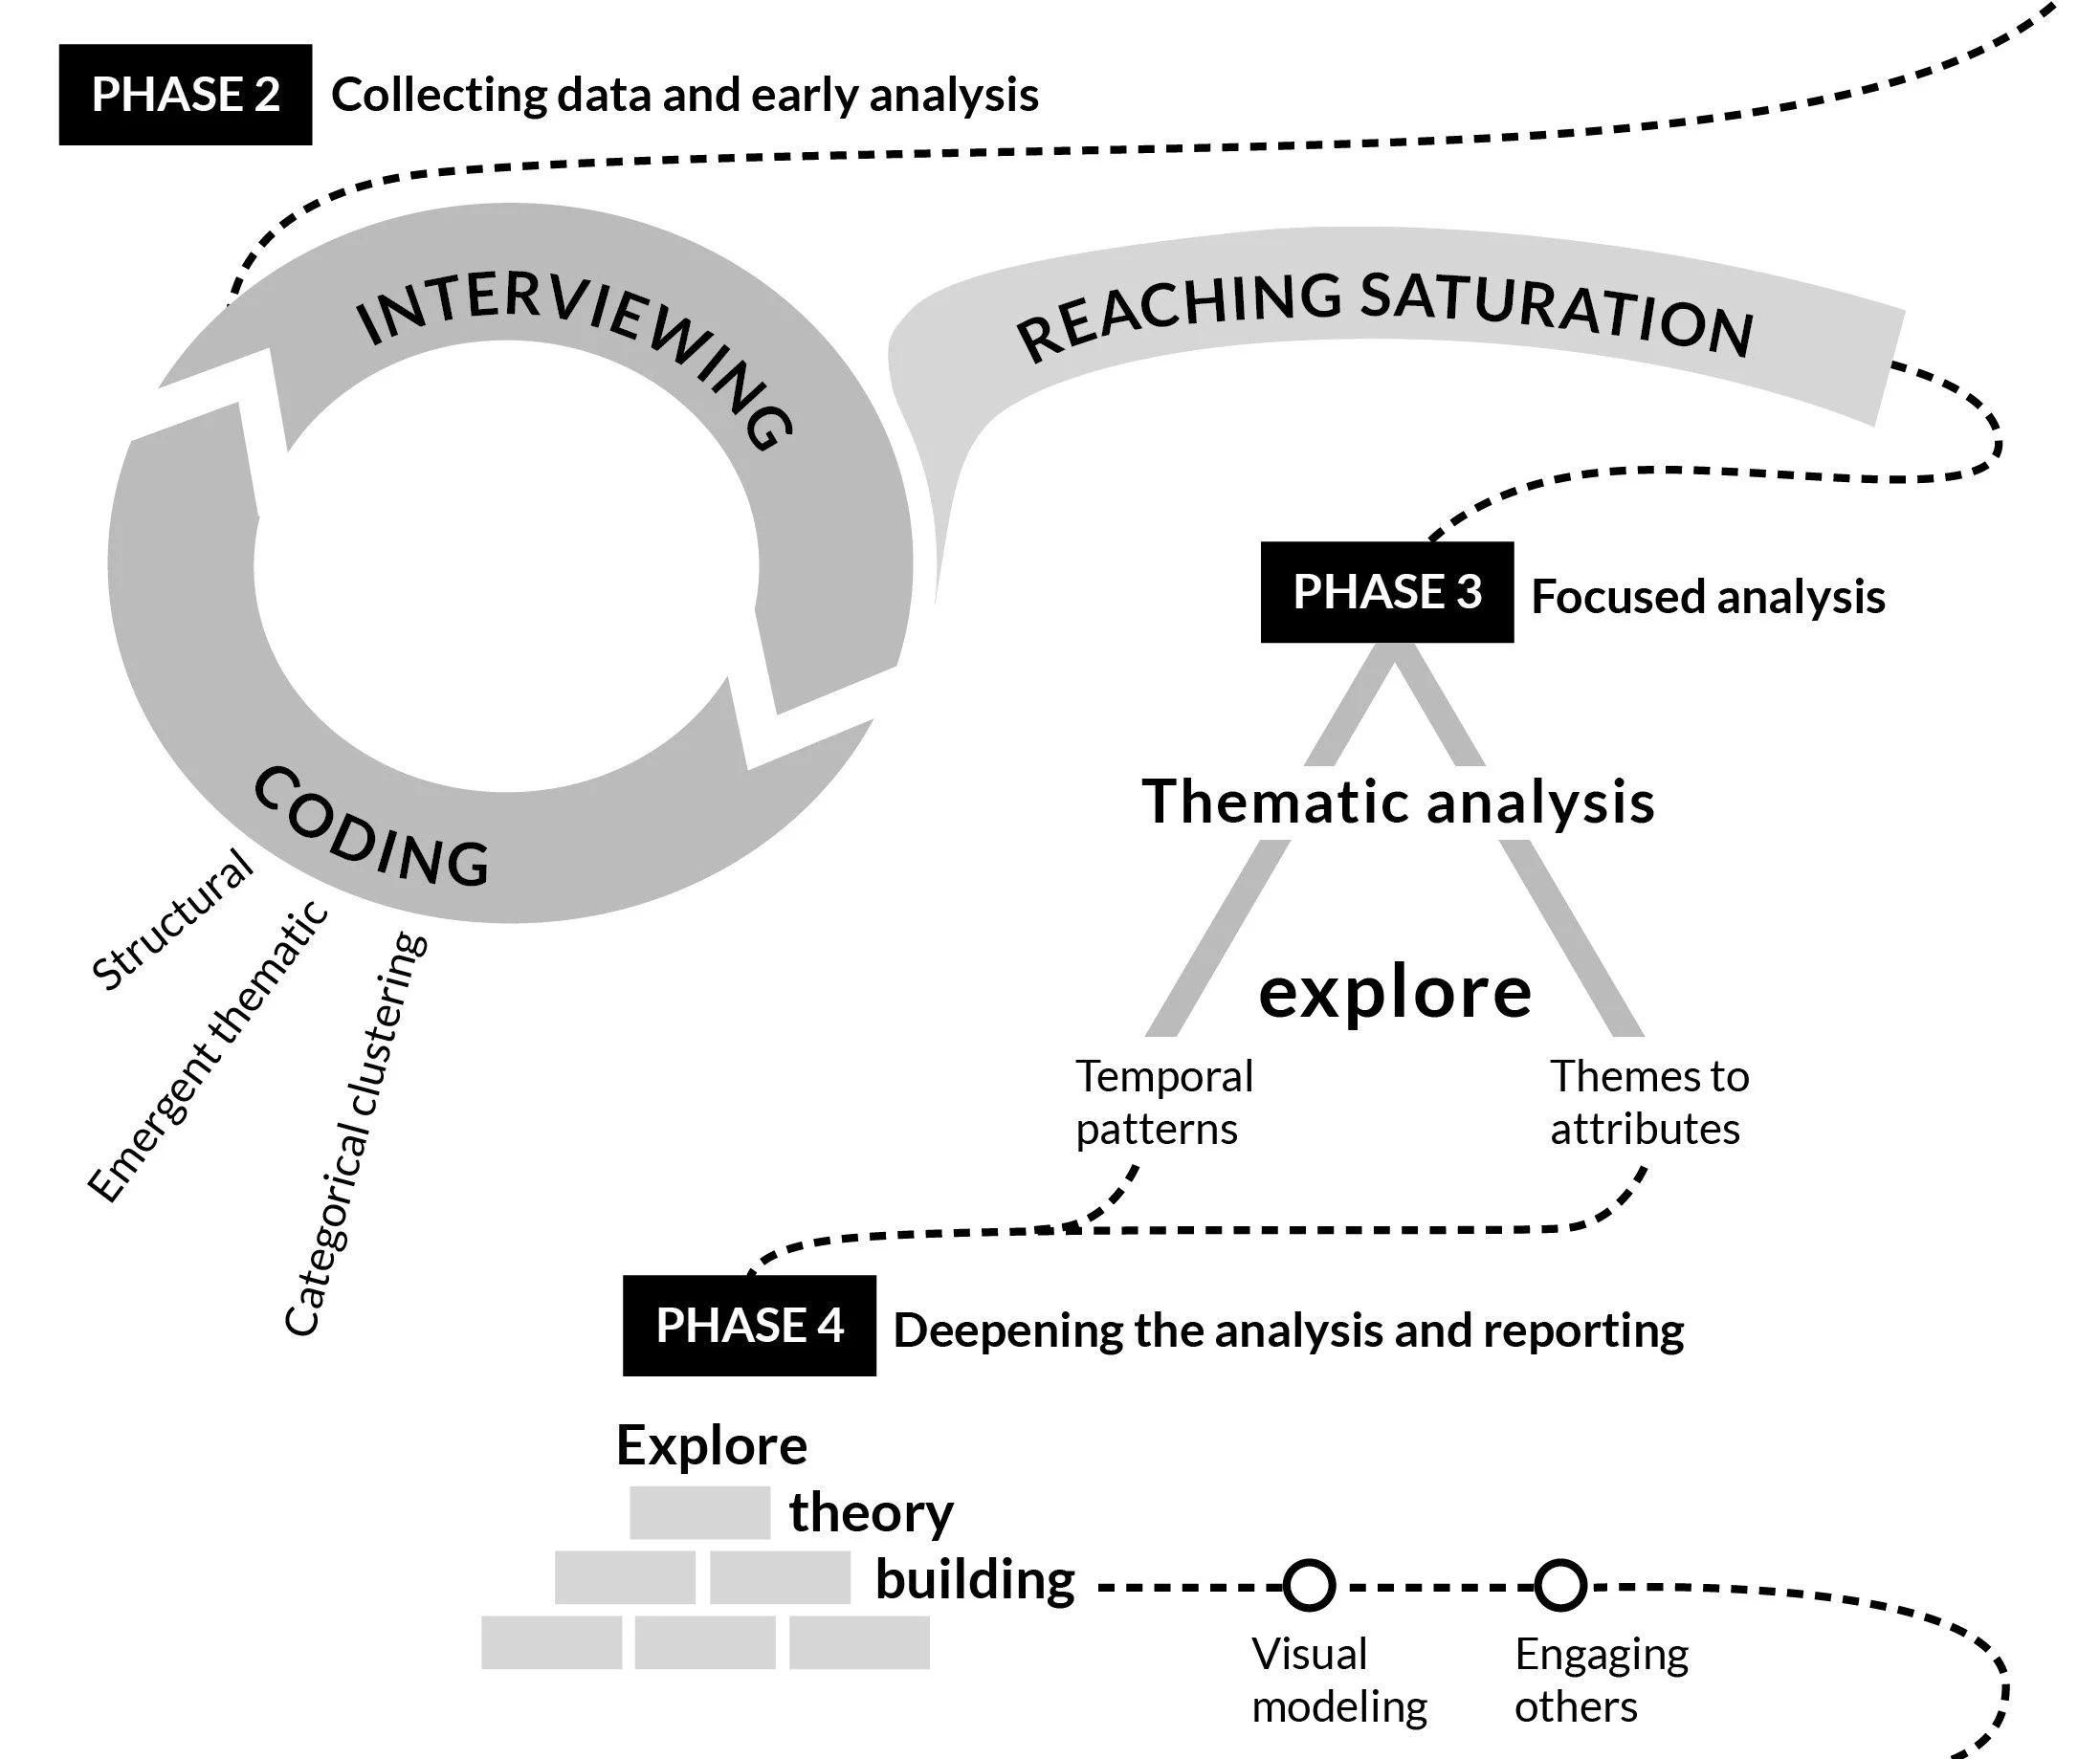
…but this is what early drafts are for! Often, seeing what doesn’t work is helpful in defining what does.
Refinement
The client used Loom as a way to provide feedback via video, in which they could share visuals. I’d never used Loom, and it was neat to see how well the platform worked for feedback. Here’s a screenshot of the client walking through what worked and didn’t work in a mid-process draft:
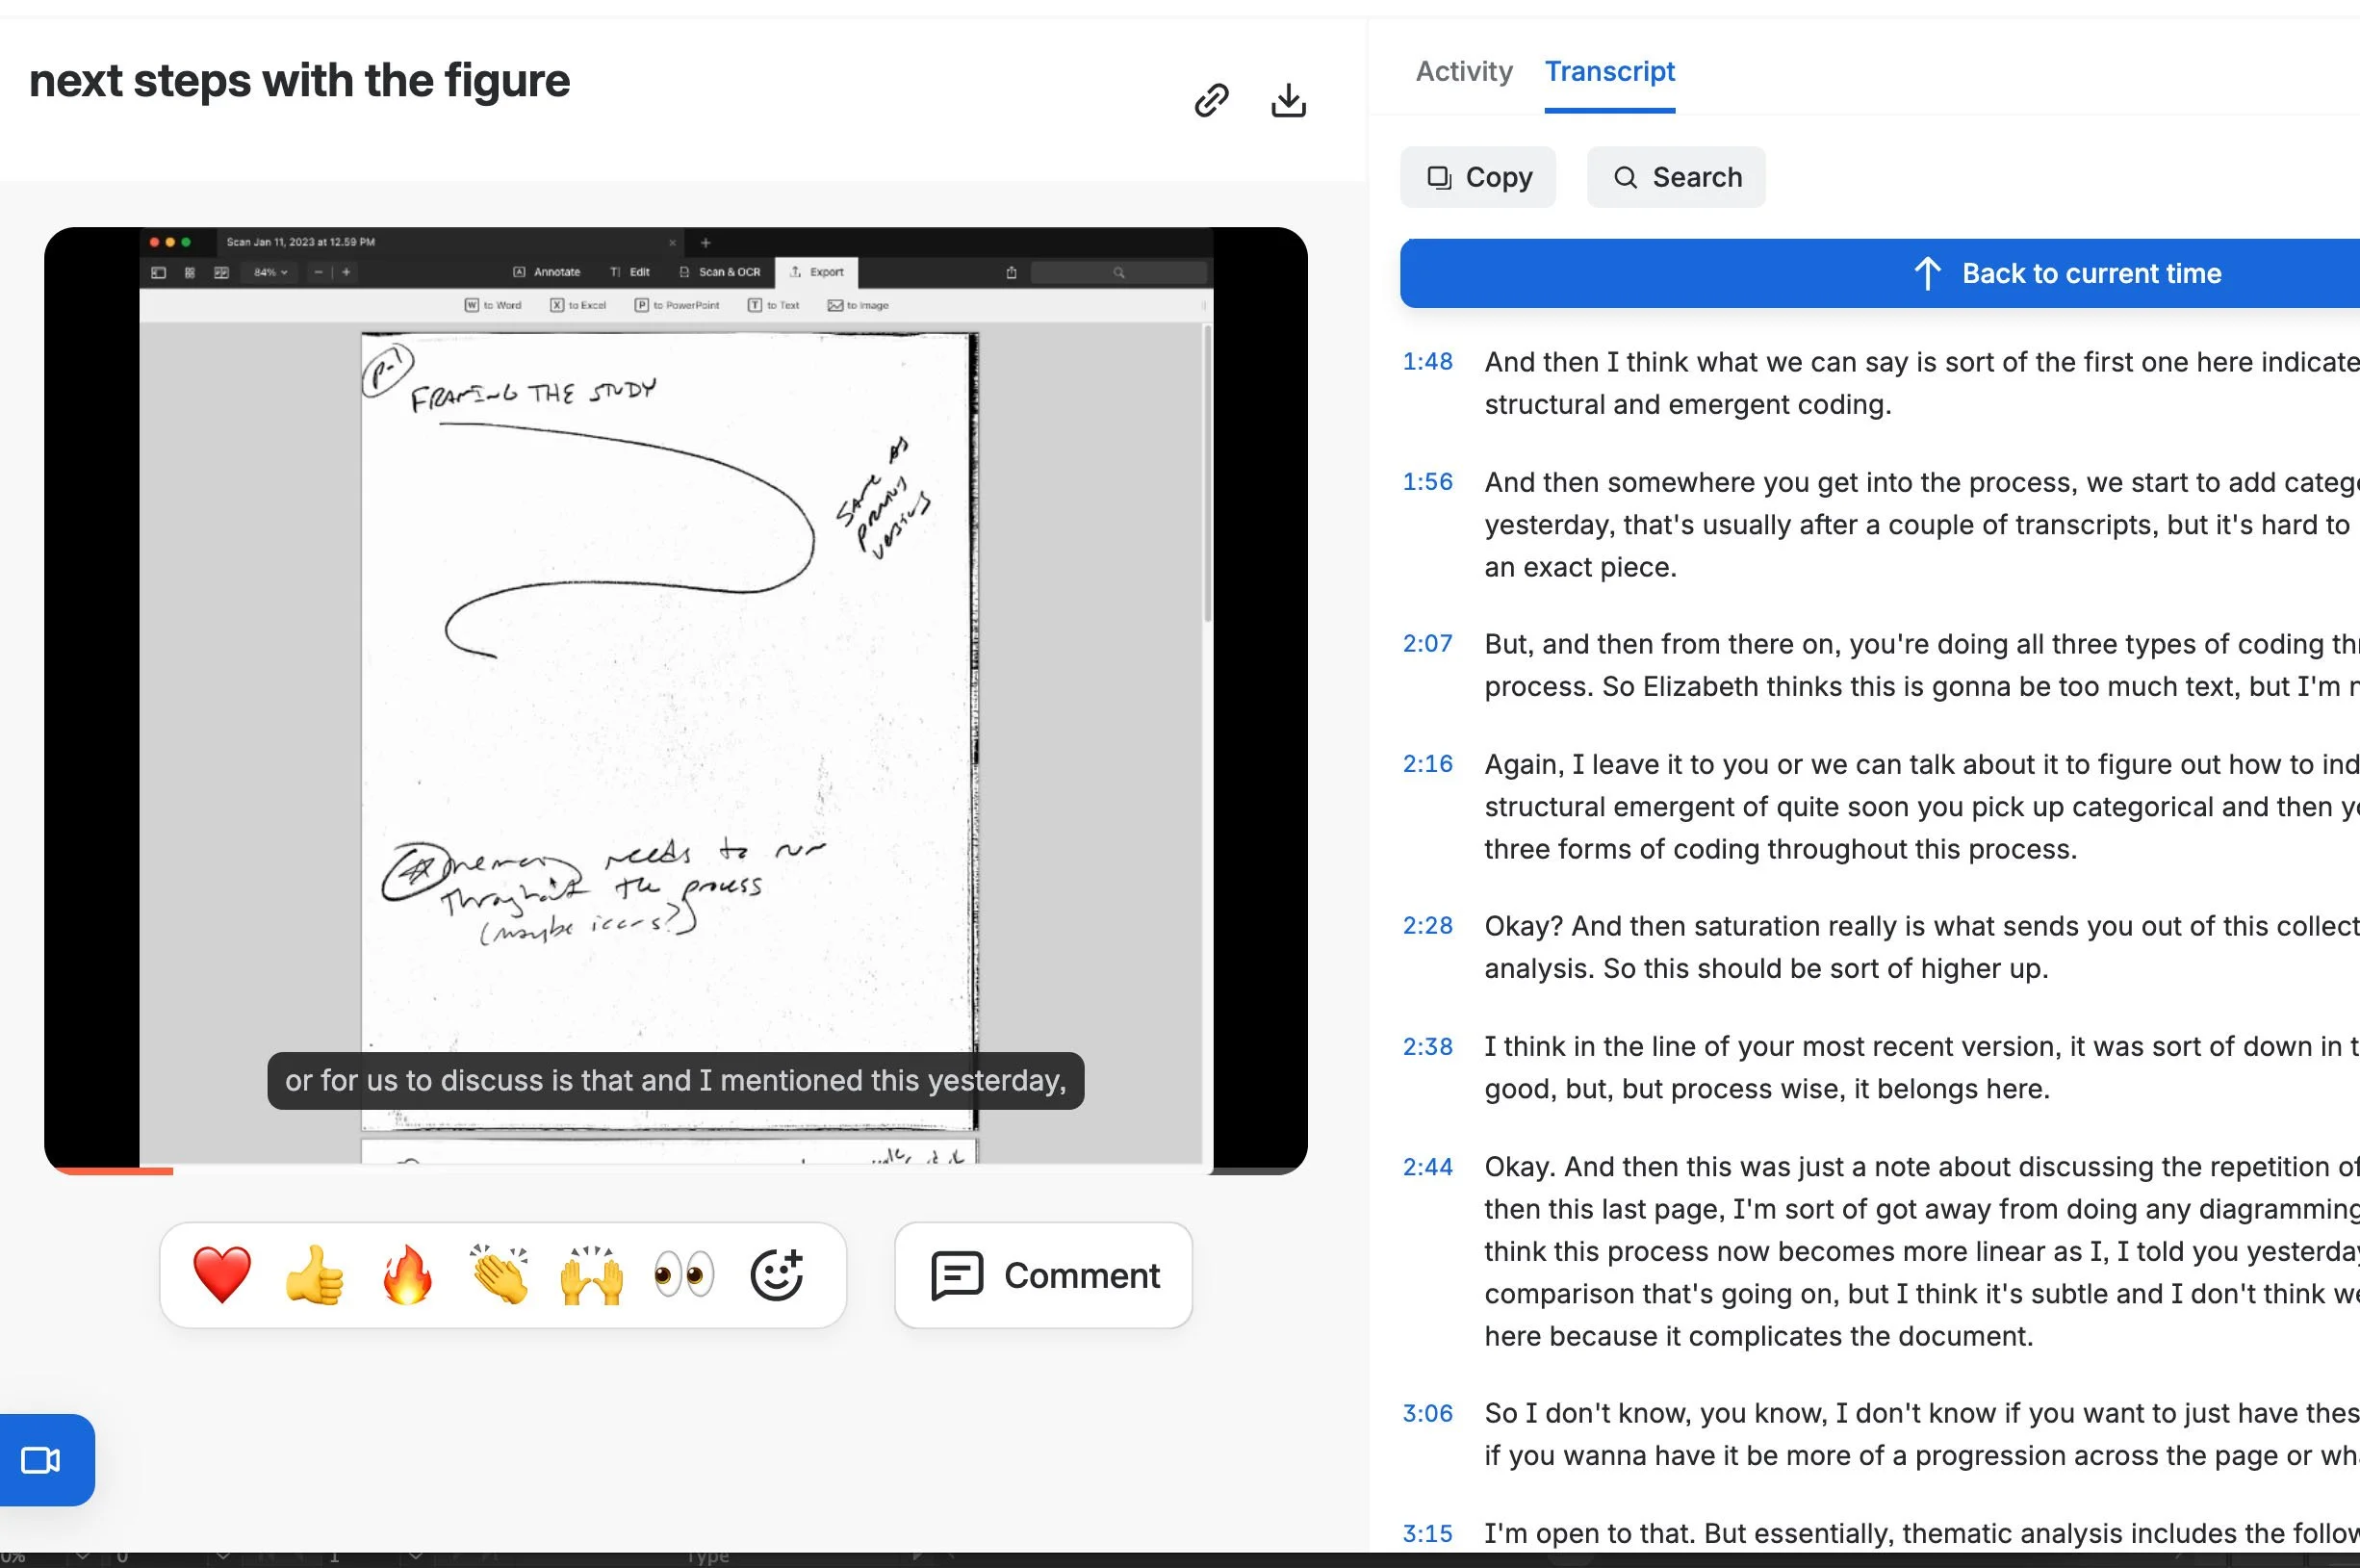
This in-depth critical feedback allowed me to refine the drafts efficiently.
Eventually, the individual phases were refined, the spiral processes were clarified, and everything came together beautifully:
Outcomes & Reflection
The clients were very satisfied with the final model, and it was integrated into their book. How gratifying to see the model in physical publication!
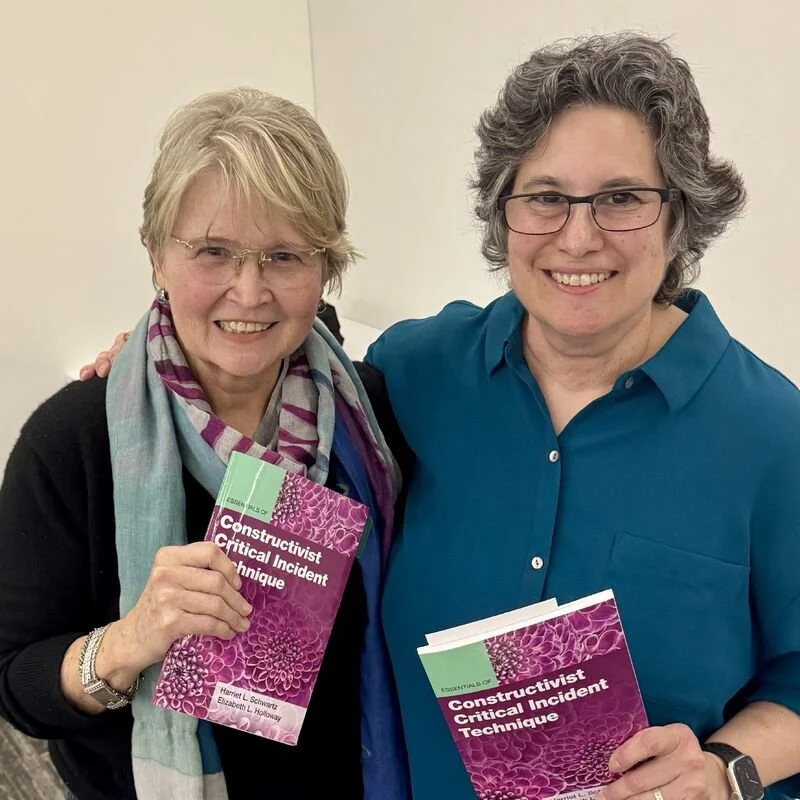
Elizabeth L. Holloway, PhD and Harriet L. Schwartz, PhD with their book Constructivist Critical Incident Technique, published in August of 2024.
Dr. Holloway and Dr. Schwartz were a pleasure to collaborate with. I really enjoyed the process of learning about their research as I worked to visually represent its essential phases. Through the process I learned how much the clients’ ability to communicate critical feedback can expedite and clarify my design process.